Islamabad AQI 12 November 2026: 153 Unhealthy, Down From 173 a Day Earlier (Pak-EPA Table)
Pak-EPA put Islamabad's PM2.5 AQI at 153, Unhealthy, on 12 November 2026, with fine dust at 1.7 times the limit. On 11 November it was 173. Full tables inside.
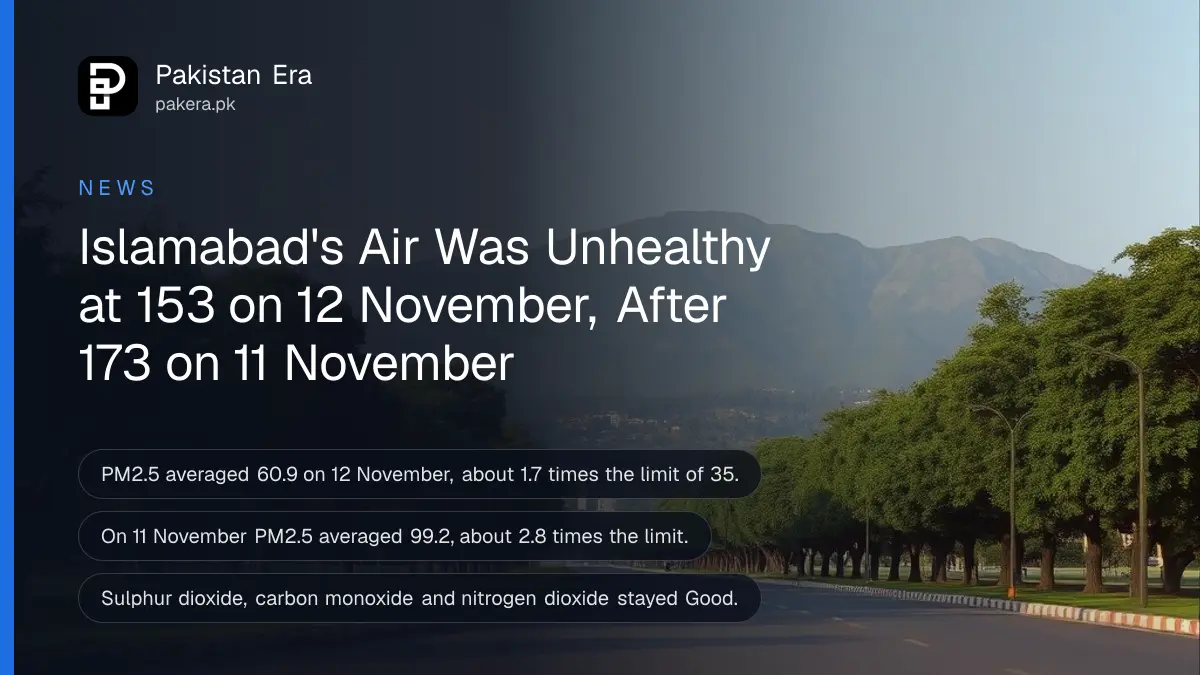
Short answer: Islamabad's air was Unhealthy on Thursday, 12 November 2026. The Pakistan Environmental Protection Agency (Pak-EPA) gave fine dust, PM2.5, an AQI of 153. The 24 hour average was 60.9 micrograms per cubic metre, against a national limit of 35. A day earlier, on 11 November, the AQI was 173.
Pak-EPA posted the 12 November table on its website on 13 November, under "Air Quality Index of Islamabad". Its 11 November table is on the same site. In both, the three gases Pak-EPA measures stayed in the Good band. Fine dust was the only pollutant over the limit.
So the air got better between Wednesday and Thursday, but it stayed in the Unhealthy band for the second day running. That matters most for children, older people and anyone with asthma or heart disease.
Islamabad's PM2.5 averaged 60.9 on 12 November, 1.7 times the limit
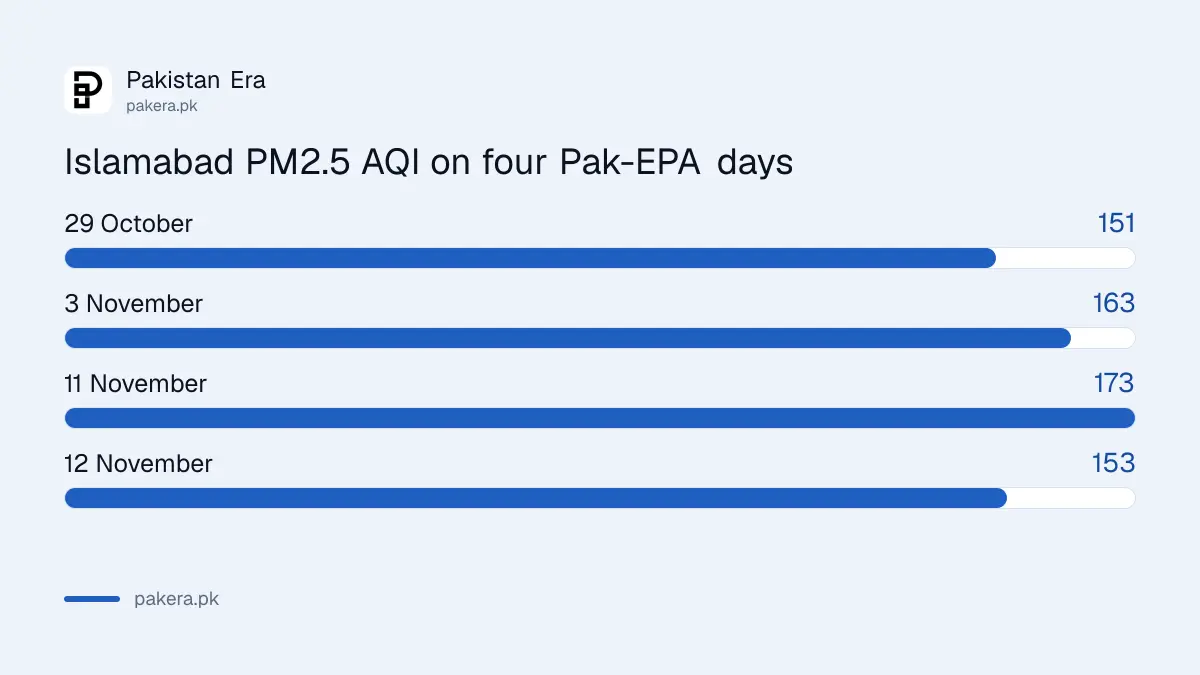
Islamabad's PM2.5 averaged 60.9 micrograms per cubic metre over 24 hours on 12 November. The National Environmental Quality Standard (NEQS), the legal limit Pak-EPA uses, is 35. That is about 1.7 times the allowed level, by our arithmetic.
PM2.5 means dust particles smaller than 2.5 micrometres. They pass deep into the lungs. Here is the 12 November table in Pak-EPA's own figures:
| Pollutant | 24 hour average | NEQS limit | AQI | Band |
|---|---|---|---|---|
| Sulphur dioxide (SO2) | 18.1 | 120 | 25 | Good |
| Carbon monoxide (CO) | 1,355.9 | 5,000 | 15 | Good |
| Nitrogen dioxide (NO2) | 12 | 80 | 11 | Good |
| Fine dust (PM2.5) | 60.9 | 35 | 153 | Unhealthy |
All values are in micrograms per cubic metre. The AQI is the number Pak-EPA printed beside each one.
Fine dust stayed level through the day. It was 63.8 from midnight to 8 am, 58.5 from 8 am to 4 pm and 60.4 from 4 pm to midnight. Every block was above the 35 limit.
On 11 November Islamabad's AQI was 173, with PM2.5 at 99.2
Wednesday 11 November was worse. Pak-EPA gave PM2.5 an AQI of 173 for the day, with a 24 hour average of 99.2. That is about 2.8 times the limit, the highest of the four Pak-EPA readings since 29 October listed below.
| Time block, 11 November | PM2.5 | CO | NO2 | SO2 |
|---|---|---|---|---|
| 00:10 to 08:00 | 95.2 | 1,328.6 | 9.2 | 17.9 |
| 08:10 to 16:00 | 98.2 | 1,115.1 | 20.5 | 18.1 |
| 16:10 to 00:00 | 104.1 | 5,095.9 | 8.5 | 19.6 |
| 24 hour average | 99.2 | 2,513.2 | 12.7 | 18.5 |
Look at the evening carbon monoxide. From 4 pm to midnight it was 5,095.9, just above the 5,000 figure Pak-EPA prints as the CO limit. The 24 hour average, 2,513.2, was well under it, so Pak-EPA still rated CO Good for the day.
Four Pak-EPA readings since late October, all Unhealthy
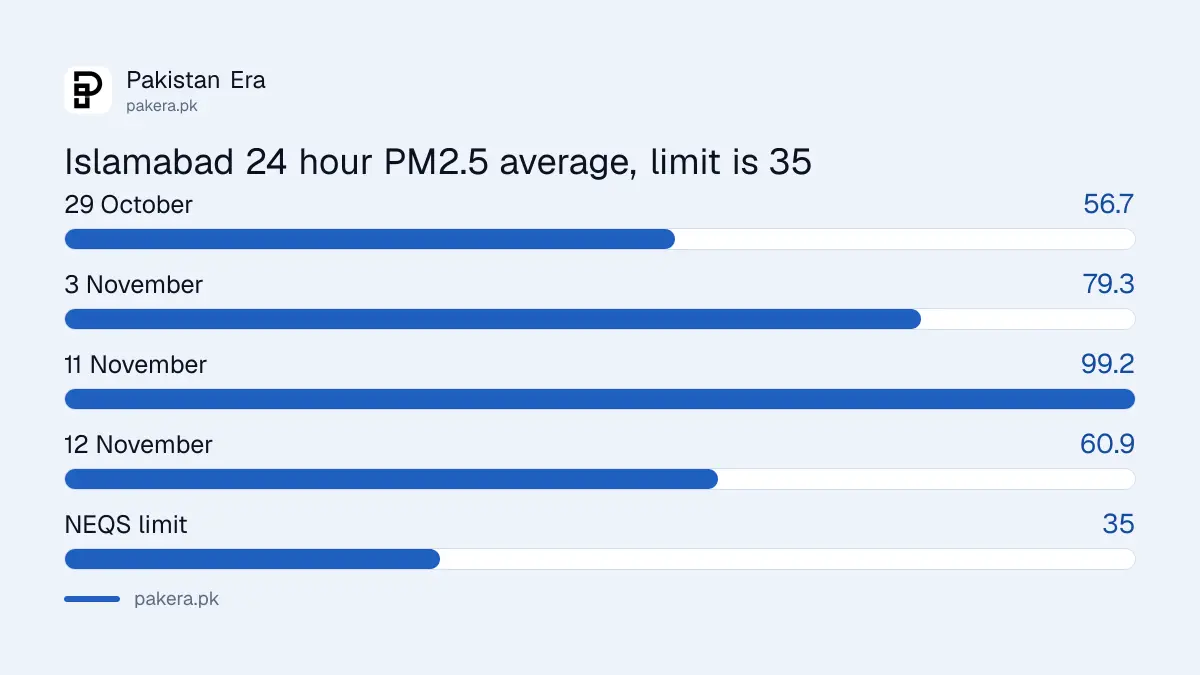
All four Islamabad tables we have read since 29 October put PM2.5 in the Unhealthy band, 151 to 200. The AQI has moved between 151 and 173. Pak-EPA does not post every day, so there are gaps between the dates.
| Day | PM2.5 average | PM2.5 AQI | Times the limit |
|---|---|---|---|
| 29 October 2026 | 56.7 | 151 | 1.6 |
| 3 November 2026 | 79.3 | 163 | 2.3 |
| 11 November 2026 | 99.2 | 173 | 2.8 |
| 12 November 2026 | 60.9 | 153 | 1.7 |
The full 3 November table is in Islamabad AQI on 3 November. The "times the limit" column is our own arithmetic, the average divided by 35.
Pak-EPA is the only official source for Islamabad's AQI
Pak-EPA's table carries a warning that any other data on Islamabad's air "is neither verified nor approved by the Pak EPA". Phone apps and private sensors often show different numbers. Rawalpindi is in Punjab, so its reading comes from Punjab EPA instead.
To read Pak-EPA's table yourself:
- Open environment.gov.pk and find the Latest News box on the home page.
- Click the item called "Air Quality Index of Islamabad".
- Open the table image and check the date printed at the top. The posting date is usually a day later.
- Read the PM2.5 column first. The AQI row at the bottom gives the band.
- Compare the 24 hour average with the NEQS row, which is the legal limit.
For Rawalpindi's three Punjab EPA stations, see Rawalpindi AQI today. The two agencies use different stations and methods, so their numbers should not be compared one for one.
People with asthma or heart disease should limit time outside
An AQI of 151 to 200 is Unhealthy. Healthy adults may feel little. Children, older people, pregnant women and anyone with asthma, lung or heart disease can react, so they should cut long or hard activity outdoors.
- Move morning walks and outdoor exercise indoors on Unhealthy days.
- Close windows in the evening. On 11 November both dust and carbon monoxide peaked after 4 pm.
- Use a fitted N95 or KN95 mask outdoors. A cloth mask does little against fine dust.
- Do not run a gas heater in a closed room overnight. Carbon monoxide has no smell.
- Keep inhalers and medicines close, and see a doctor if breathing gets harder.
The warning signs that need a doctor are set out in NIH's smog advice for pregnant women and heart and asthma patients.
Common questions
What was Islamabad's AQI on 12 November 2026?
Pak-EPA gave PM2.5 an AQI of 153, which is Unhealthy. The other three pollutants were Good.
What was Islamabad's AQI on 11 November 2026?
It was 173, also Unhealthy, with PM2.5 averaging 99.2 against a limit of 35.
How far above the limit was Islamabad's PM2.5 on 12 November?
The 24 hour average was 60.9, about 1.7 times the limit of 35.
Did carbon monoxide cross the limit?
Only in one block. From 4 pm to midnight on 11 November it was 5,095.9, just over 5,000. The daily average was well under.
Does Pak-EPA post Islamabad's AQI every day?
No. Tables appear on some days only, usually a day after the date they cover.
Where can I check Islamabad's AQI?
On environment.gov.pk, in the Latest News box, under "Air Quality Index of Islamabad".
How we verified this
What we checked and where we read it.
We read both tables on the Pak-EPA website on 14 November 2026. The home page Latest News box listed "Air Quality Index of Islamabad" dated 13 November 2026, and that item opens the table image dated 12-11-2026. The 11-11-2026 table is an image in the same folder on the site; it was not linked from the Latest News box when we checked. The 29 October and 3 November figures come from our earlier readings of Pak-EPA's tables. The "times the limit" column is our arithmetic.
About the author

Public Services and Education Journalist
Fajr Riaz is a journalist and content writer at Pakistan Era, based in Lahore. She covers the questions people meet in everyday life in Pakistan: how a public service works, what a change in the rules means, and where to find a reliable answer.