Pakistan Exports by Product, July to September 2026: Knitwear $1.48 Billion Leads, Rice Up 56% (PBS Full List)
Pakistan exported $8.44 billion of goods from July to September 2026. See the top 15 products from PBS, from knitwear to rice, which grew and which fell.
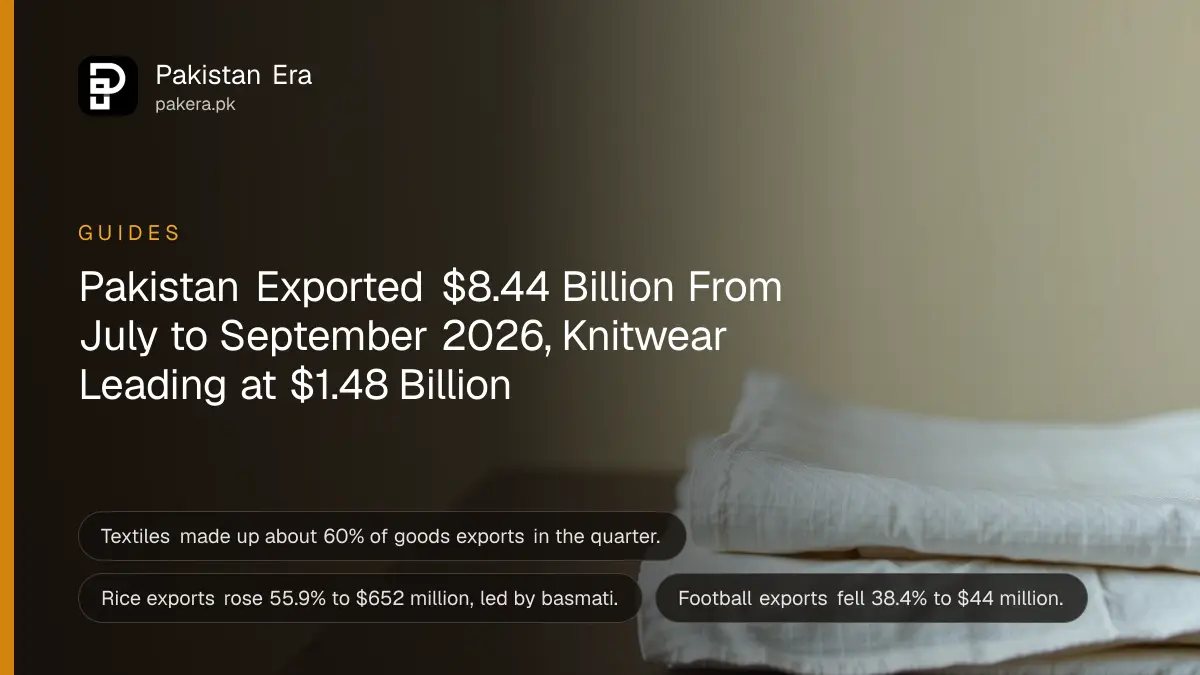
Pakistan exported $8.44 billion of goods from July to September 2026, 11.1% more than a year earlier, according to the Pakistan Bureau of Statistics (PBS). Knitwear was the biggest single product at $1.48 billion, and rice grew fastest among the big items, up 55.9% to $652 million.
We downloaded the PBS export sheet for September 2026, which lists more than 45 products for the first quarter of the 2026-27 fiscal year. Below is what Pakistan sells abroad, ranked, with each product's change from the same three months of 2025. We also explain which trades are growing, which are shrinking, and what that means for jobs and prices at home.
Pakistan's top 15 exports from July to September 2026
Textiles made up $5.03 billion, or about 60%, of Pakistan's $8.44 billion of goods exports in the quarter. Knitwear, readymade garments and bed wear alone brought in $3.56 billion. Rice was the largest non-textile export at $652 million.
| Rank | Product | July to September 2026 ($ million) | Change on 2025 |
|---|---|---|---|
| 1 | Knitwear | 1,482.7 | +4.1% |
| 2 | Readymade garments | 1,223.2 | +15.7% |
| 3 | Bed wear | 852.3 | -0.1% |
| 4 | Rice | 652.4 | +55.9% |
| 5 | Cotton cloth | 425.3 | -5.3% |
| 6 | Chemicals and pharmaceutical products | 352.6 | +5.9% |
| 7 | Towels | 291.6 | +10.0% |
| 8 | Cotton yarn | 227.1 | +24.5% |
| 9 | Other made-up textile articles | 223.1 | +7.9% |
| 10 | Petroleum products | 187.8 | +103.8% |
| 11 | Leather manufactures | 181.1 | +18.6% |
| 12 | Meat and meat products | 148.0 | +21.1% |
| 13 | Oil seeds, nuts and kernels | 124.6 | +240.9% |
| 14 | Surgical and medical instruments | 121.2 | +8.8% |
| 15 | Engineering goods | 118.7 | +5.7% |
We left out two catch-all lines, "all other food items" at $201.0 million and "other textile materials" at $178.2 million, because they are not single products. PBS lists all of these as "selected commodities". Its four product groups add up to about $7.73 billion. The rest, about $0.72 billion, is spread across items it does not list at all. The month-by-month totals for the whole year are in Pakistan's trade deficit for every month of 2026.
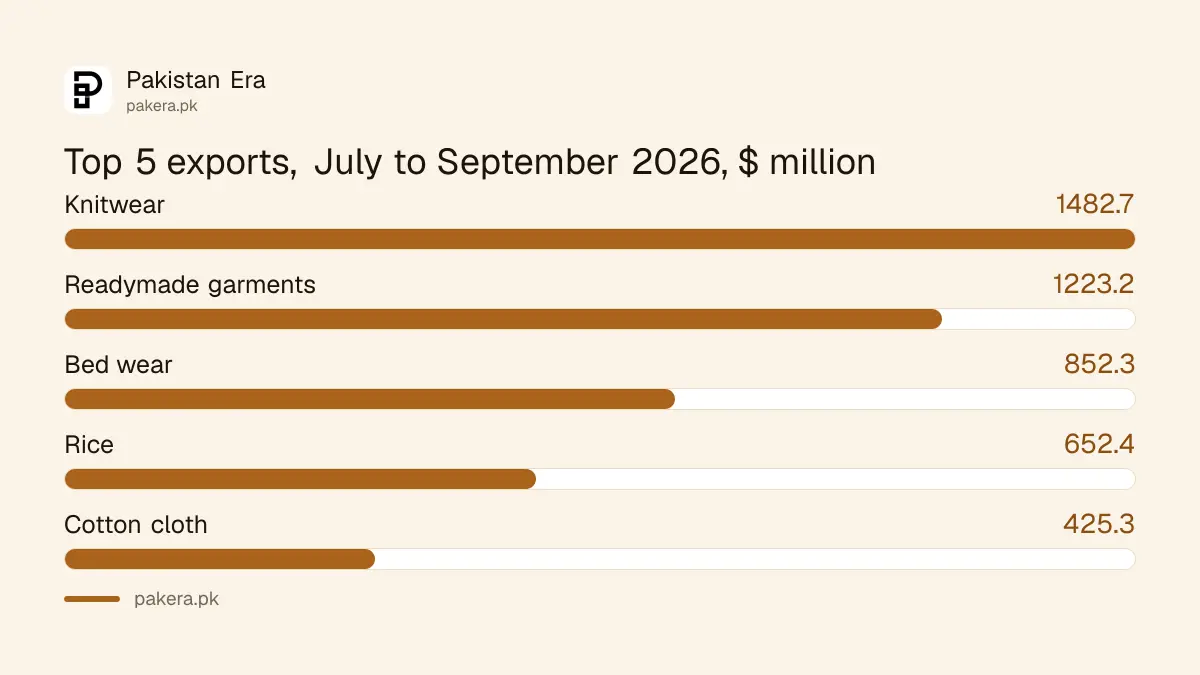
Rice exports grew 55.9% to $652 million
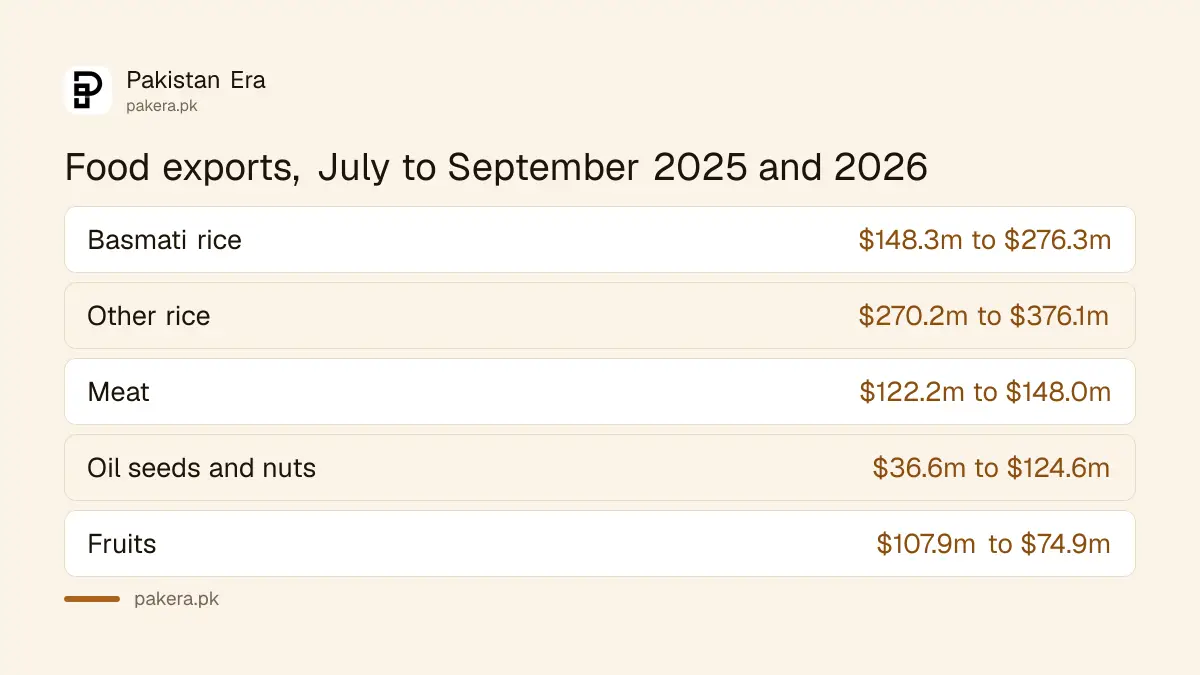
Rice was the standout of the quarter. Exports rose from $418.5 million to $652.4 million. Basmati grew faster, up 86.3% to $276.3 million, while other rice rose 39.2% to $376.1 million.
Food exports as a group rose 25.3% to $1.39 billion. Oil seeds and nuts more than tripled to $124.6 million, and meat rose 21.1%. Fruit exports fell 30.6% to $74.9 million and vegetables 20.5%. For farmers and traders, these numbers show where foreign buyers are paying more this season.
| Food export | 2025 ($ million) | 2026 ($ million) | Change |
|---|---|---|---|
| Basmati rice | 148.3 | 276.3 | +86.3% |
| Other rice | 270.2 | 376.1 | +39.2% |
| Meat and meat products | 122.2 | 148.0 | +21.1% |
| Oil seeds, nuts and kernels | 36.6 | 124.6 | +240.9% |
| Fruits | 107.9 | 74.9 | -30.6% |
All figures are for July to September of each year.
Garments grew, but cloth and footballs fell
Textile exports rose 5.3% to $5.03 billion, slower than total exports. The growth came from finished goods. Readymade garments rose 15.7% and towels 10%. Cotton cloth fell 5.3%, and bed wear was flat.
Outside textiles, sports goods fell 17.7% to $91.3 million. Footballs fell hardest, down 38.4% to $44.1 million, which matters for Sialkot, where most of them are made. Pharmaceutical exports dropped 25.5% to $73.3 million. Leather garments rose 21.4% and leather footwear 18.8%.
- Growing: readymade garments, rice, cotton yarn, leather goods, meat, surgical instruments, tyres.
- Shrinking: cotton cloth, footballs, pharmaceuticals, fruits, vegetables, tents and canvas, carpets.
- Flat or slow: bed wear, cement, and knitwear at about 4%.
The long-run picture for these same trades, from the last Economic Survey, is in Pakistan's exports in the Economic Survey 2025-26.
What these export figures mean at home
Export figures are not just for traders. They tell you which industries are likely to hire, which are under pressure, and where the dollars that support the rupee come from. Here is how to read them for your own situation.
- If you work in a garment or towel factory, orders grew this quarter, which usually means steadier shifts.
- If you work in weaving or cloth, exports fell 5.3%, so mills may cut hours.
- If you grow or trade rice, foreign demand was strong, which supports prices at the mill gate.
- If you buy rice at home, strong exports can push local prices up when supply is tight.
- If you want to start exporting, fast-growing lines like garments and leather goods show where buyers are active.
New exporters can follow the official steps in TDAP's five steps for new exporters.
How to check export figures by product yourself
PBS posts a free export sheet by product every month. It shows the month, the previous month, the same month a year earlier, and the fiscal year to date.
- Open pbs.gov.pk and go to External Trade Statistics.
- Download the "Export" spreadsheet for the latest month, for example Export_September-2026.
- The first table is the single month. Scroll down for the "July to" table, which covers the fiscal year so far.
- Values are in rupees million and in US dollars thousand. Divide the dollar figure by 1,000 to get millions.
Common questions
What is Pakistan's biggest export in 2026?
Knitwear, at $1.48 billion from July to September 2026. Readymade garments came second at $1.22 billion.
How much rice did Pakistan export in 2026?
$652.4 million from July to September 2026, up 55.9% on the same months of 2025. Basmati was $276.3 million of that.
What share of Pakistan's exports are textiles?
About 60%. Textiles were $5.03 billion of the $8.44 billion of goods exported from July to September 2026.
Which exports fell in 2026?
Cotton cloth, footballs, pharmaceuticals, fruits and vegetables all fell in the July to September quarter compared with 2025.
Do these figures include IT exports?
No. These are goods only. IT and freelance income are services, which PBS and the State Bank report separately.
How we verified this
What we checked, where we read it, and what we could not confirm.
Last checked 4 November 2026 at about 06:00 PKT. We read the PBS external trade statistics page and downloaded the September 2026 export sheet, using its July to September table. The ranking, the shares and the rounding to $ million are our own. The sheet's notes say the data come from Pakistan Single Window and are validated by FBR. October 2026 figures were not yet posted when we checked.
About the author

Global Affairs & Political Economy Writer
Muhammad Hatim is a book lover who started writing because he enjoys it. At Pakistan Era he writes about international relations, geopolitics and the global economy, with a particular interest in South Asia and the forces behind current events.