Check Which Pakistani Exports Rose and Fell: Textiles 59.6% of $22.7 Billion, Rice Down 38.6%
Pakistan exported $22.7 billion in July to March 2025-26: textiles flat, rice down 38.6%, cement up 17.7%. Check your product's group and what to do next.
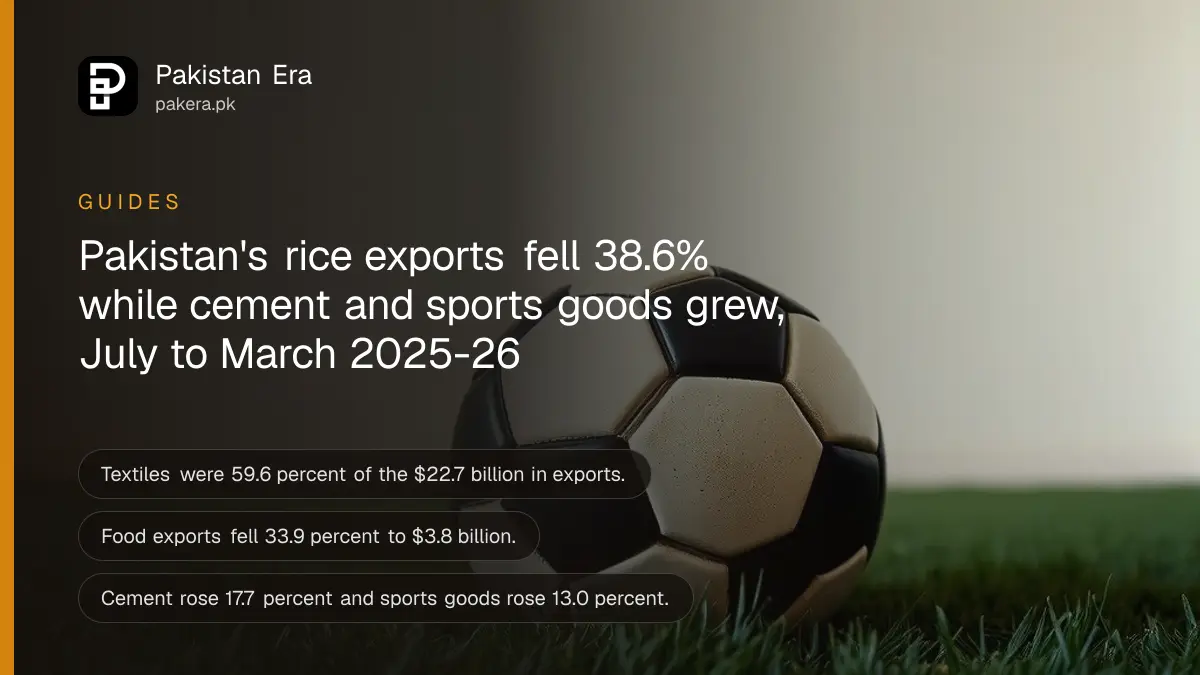
Short answer: In July to March 2025-26, Pakistan's goods exports were $22.7 billion. Textiles made up 59.6 percent and stayed almost flat. Food exports fell 33.9 percent to $3.8 billion because rice dropped 38.6 percent. Cement, sports goods and petroleum products grew. The Finance Division's Economic Survey 2025-26 reports all of this.
If you sell something abroad, or plan to, the first question is simple: is my product's market growing or shrinking? The national numbers cannot answer that for your shop. But they show which way the wind blows.
We read the Trade and Payments chapter of the Economic Survey 2025-26 on 14 October 2026. It covers the first nine months of the financial year, which is the latest full-chapter data. The figures below come from the Pakistan Bureau of Statistics through the Survey, and we did not check them against the Bureau's own tables.
Exports fell to $22.7 billion while imports rose to $50.7 billion
The Survey reports goods exports of $22.7 billion for July to March 2025-26, against $24.7 billion a year earlier. Imports rose 6.9 percent to $50.7 billion from $47.4 billion. The merchandise trade deficit widened to $27.9 billion from $22.7 billion.
The Survey blames lower food exports, weak global demand, flood losses and trouble on the Afghan border since mid-October 2025. It says the fall was not broad based. It was mainly rice.
Services did better. Services exports rose 17.2 percent, and IT exports rose 19.8 percent. We report the monthly IT figures in our note on IT exports in August 2026. For the latest monthly goods trade, see the September 2026 trade report.
Textiles stayed flat at $13.5 billion
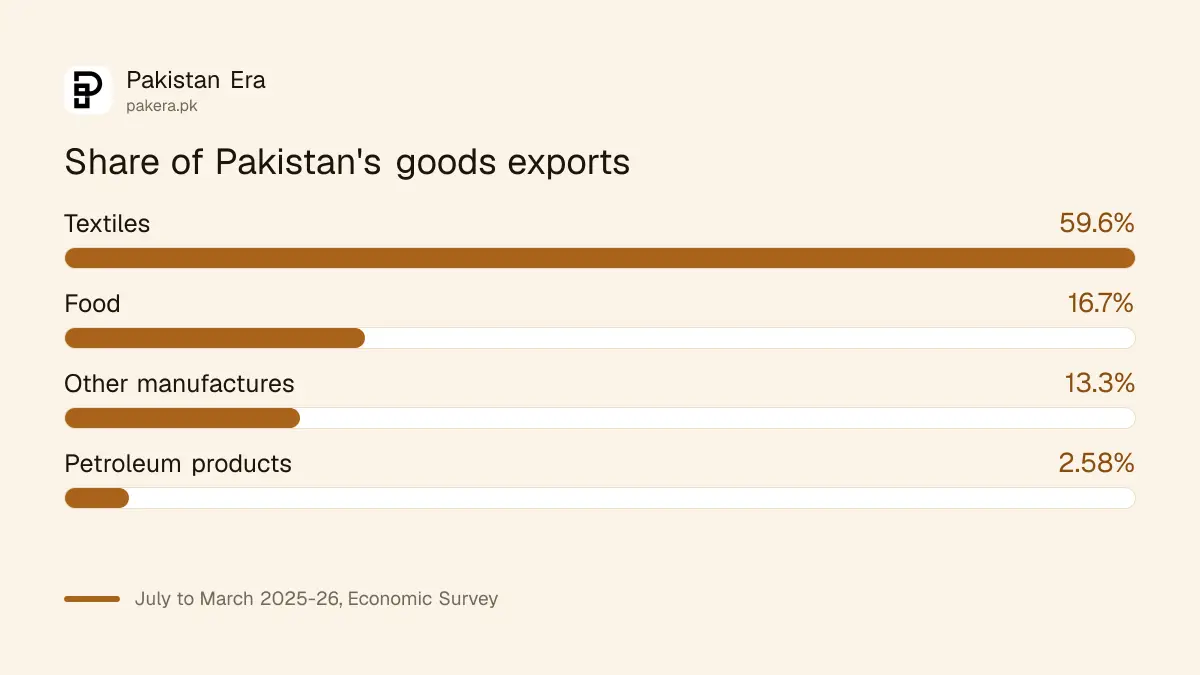
Textiles were 59.6 percent of exports, worth $13.5 billion, down just 0.5 percent. Readymade garments rose 3.8 percent to $3.2 billion. Bed wear rose 0.3 percent to $2.4 billion. Knitwear fell 1.1 percent to $3.7 billion. Cotton cloth fell 10.9 percent, and cotton yarn rose 4.4 percent.
The Survey says flood damage to the cotton crop slowed ginning early in the year. It also says weaker demand for cotton cloth, an intermediate product, pulled that line down. If you sell finished garments, the picture is steadier than if you sell cloth.
The cotton side of the story is in our check of the cotton spot rate and phutti price.
Rice and other food exports fell sharply
Food exports were 16.7 percent of the total, worth $3.8 billion, down 33.9 percent. Rice exports fell 38.6 percent. The Survey gives three reasons: lower world prices, a return of normal global rice supply, and changed regional trade because of border security measures.
Oilseeds, nuts and vegetables also declined. Fish and meat products and fruit improved. The Survey says the government gave Drawback of Local Taxes and Levies support to rice and is looking at new land routes to Central Asia for perishables.
| Export group | Value | Change |
|---|---|---|
| Textiles | $13.5 billion | Down 0.5 percent |
| Food | $3.8 billion | Down 33.9 percent |
| Cement | $271 million | Up 17.7 percent |
| Sports goods | $319 million | Up 13.0 percent |
| Petroleum products | $586 million | Up 37.5 percent |
| Pharmaceuticals | $248 million | Down 30.1 percent |
| Plastic materials | $248 million | Down 32.6 percent |
Check what is happening to your crop price too. Our report on Pakistan's crop output gives the harvest side of the same story.
Cement, sports goods and petroleum products grew
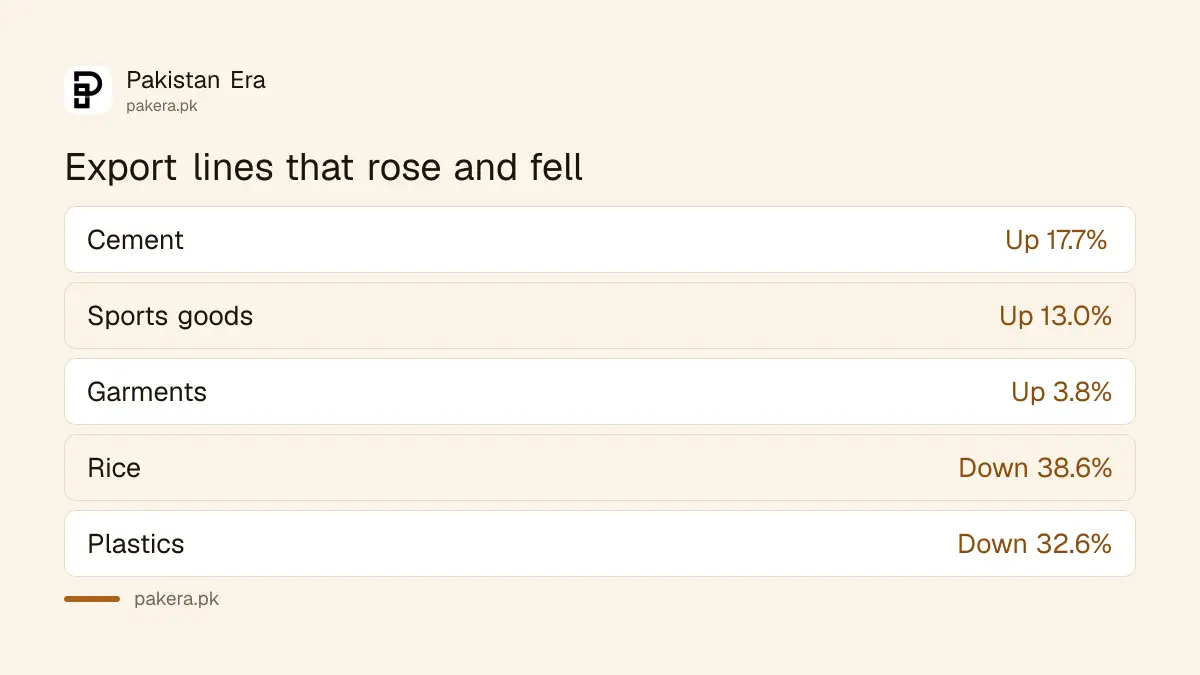
Cement exports rose 17.7 percent to $271 million on higher volume and better prices. Sports goods rose 13.0 percent to $319 million, driven by football volumes. Petroleum product exports rose 37.5 percent to $586 million, though they are only 2.58 percent of the total.
Pharmaceuticals fell 30.1 percent and plastic materials fell 32.6 percent, each to $248 million. Surgical and medical instruments dipped 1.0 percent to $338 million. Engineering goods held steady at $305 million. The Survey puts all other manufactured exports at 13.3 percent of the total, down 4.9 percent.
What an exporter can do with these numbers
Compare your product to its group, then check market access and support. A product in a growing group still needs a buyer. A product in a falling group may need a new market. The steps below are a practical order, not from the Survey.
- Find your product's group in the table above and note whether it grew or fell.
- Check the tariff and rules in your target market. See the new US 10 percent tariff on Pakistani goods and the EU GSP+ rules from 2027.
- Check what you can claim back. Read how to claim the 1 or 2 percent export rebate.
- Protect your invoices with export credit insurance from EXIM Bank.
- If you are not yet registered, start with exporter registration on WeBOC and TDAP.
Nine months of data do not predict the next nine. Use them as a map, and talk to buyers before you change your plans.
Questions about Pakistan's exports
How much did Pakistan export in July to March 2025-26?
The Survey reports $22.7 billion of goods exports, against $24.7 billion a year earlier.
What share of exports is textiles?
Textiles were 59.6 percent of exports, worth $13.5 billion, down 0.5 percent.
Why did rice exports fall?
The Survey cites lower world prices, normal global supply after a high base, and changed regional trade after border security measures.
Which exports grew?
Cement rose 17.7 percent, sports goods 13.0 percent and petroleum products 37.5 percent. Garments rose 3.8 percent.
Did imports rise?
Yes. Imports rose 6.9 percent to $50.7 billion, mainly transport, food and machinery.
How we verified this
What we checked, where we read it, and what we could not confirm.
Last checked on 14 October 2026, Pakistan time. We read the Trade and Payments chapter of the Finance Division's Economic Survey 2025-26. We did not check the Bureau of Statistics tables, and the Survey notes that its merchandise trade section differs from the balance of payments data. Figures cover July to March only.
About the author

Public Services and Education Journalist
Fajr Riaz is a journalist and content writer at Pakistan Era, based in Lahore. She covers the questions people meet in everyday life in Pakistan: how a public service works, what a change in the rules means, and where to find a reliable answer.