Pakistan Trade Deficit 2026: Every Month's Exports and Imports, January to September (PBS Full List)
Pakistan ran a $31.06 billion goods trade deficit from January to September 2026. See every month's PBS exports and imports, the 2025 figures and what it means.
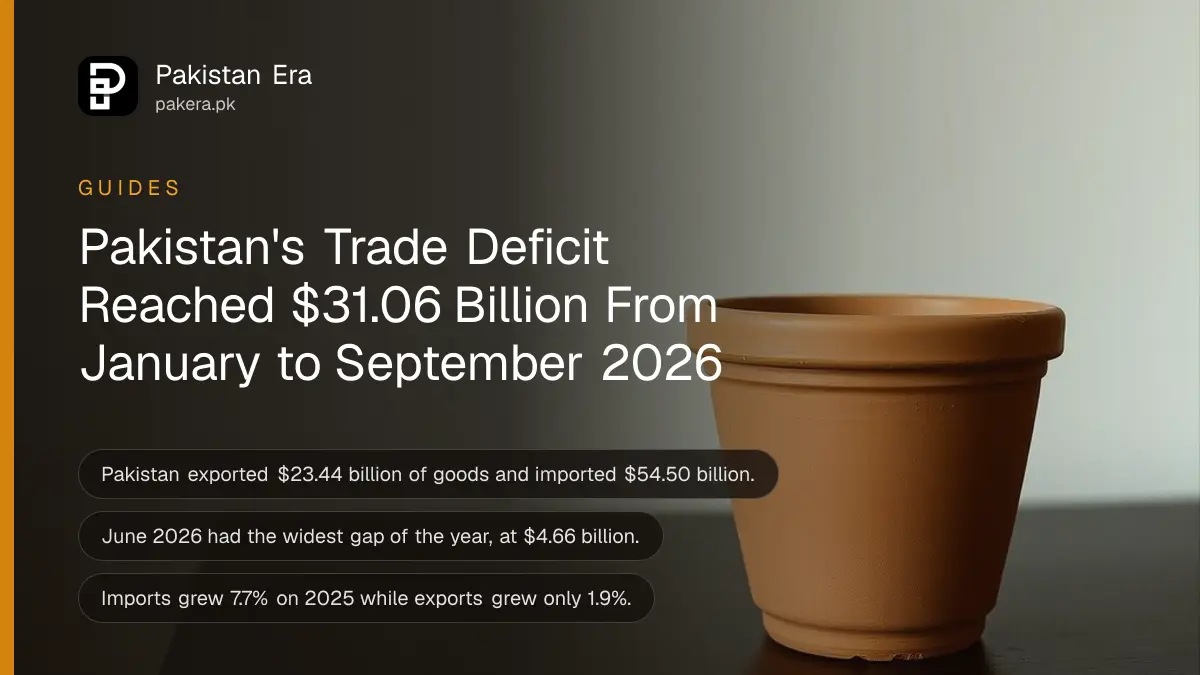
Pakistan's trade deficit in goods was $31.06 billion from January to September 2026, according to the Pakistan Bureau of Statistics (PBS). The country exported $23.44 billion of goods and imported $54.50 billion, so it bought $2.33 of foreign goods for every $1 it sold abroad.
We opened every monthly trade summary that PBS has posted for 2026 and took the final figure for each month. Below is the deficit for every month, the same months of 2025 for comparison, the worst and best months, what a wide gap means for prices and the rupee, and how to read the PBS figures yourself. October's figures had not been posted when we checked early on 4 November.
Every month's exports, imports and deficit in 2026
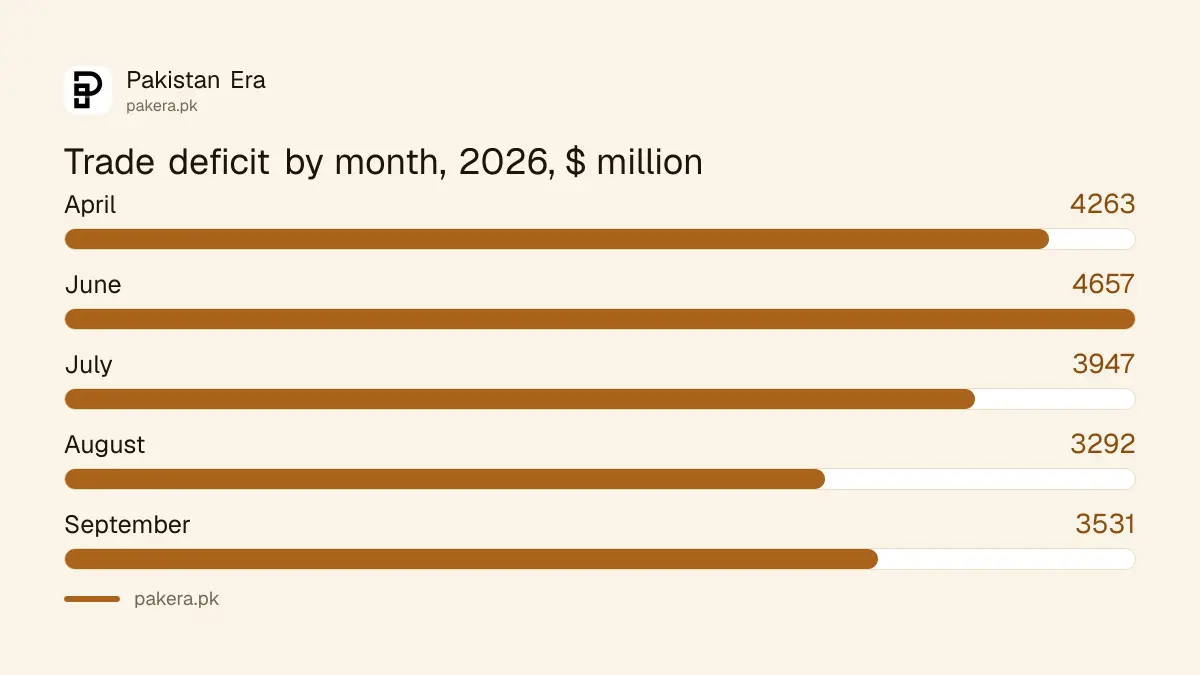
Pakistan ran a goods trade deficit in every month of 2026, from $2.75 billion in January to $4.66 billion in June. Exports stayed between $2.24 billion and $3.06 billion a month. Imports swung far more, from $5.10 billion to $6.90 billion.
| Month | Exports ($ million) | Imports ($ million) | Deficit ($ million) |
|---|---|---|---|
| January | 3,055 | 5,805 | 2,750 |
| February | 2,276 | 5,290 | 3,014 |
| March | 2,264 | 5,103 | 2,839 |
| April | 2,468 | 6,731 | 4,263 |
| May | 2,689 | 5,454 | 2,765 |
| June | 2,242 | 6,899 | 4,657 |
| July | 2,951 | 6,898 | 3,947 |
| August | 2,532 | 5,824 | 3,292 |
| September | 2,961 | 6,492 | 3,531 |
| January to September | 23,438 | 54,496 | 31,058 |
January to August are final figures. September is PBS's revised figure and may change again by a few million dollars when the final number comes with the October release. September's own story, with its 18% export rise, is in the September 2026 trade deficit.
The deficit is 12.6% wider than in the same months of 2025
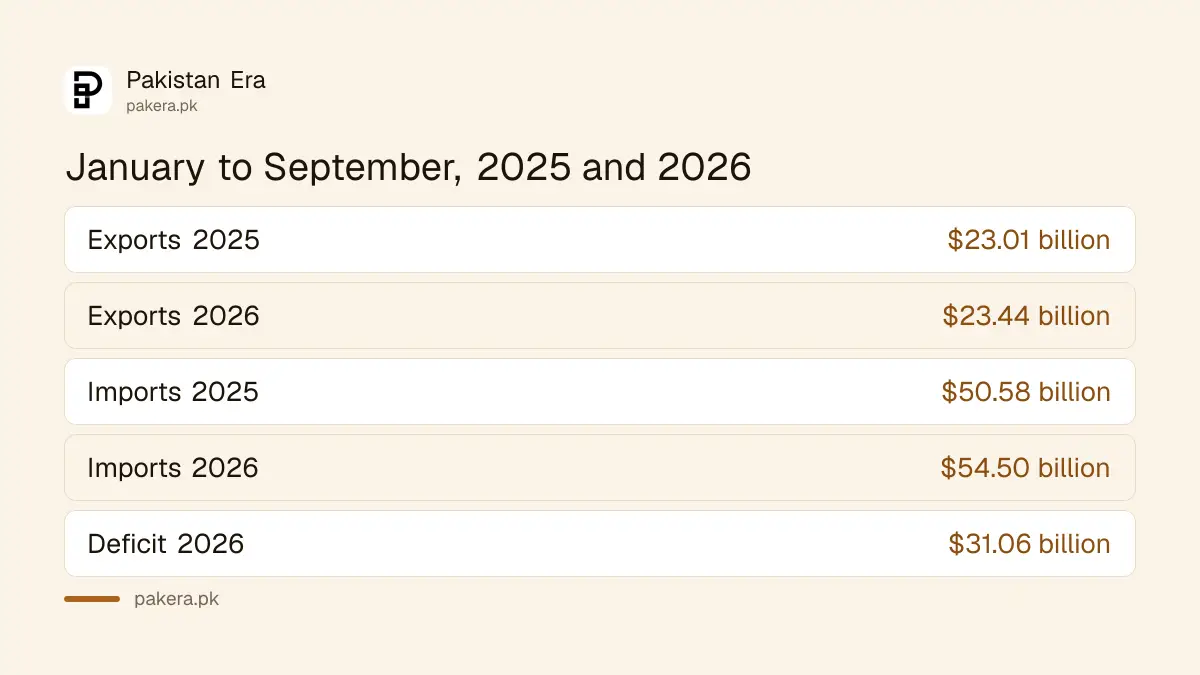
From January to September 2026, the deficit was $31.06 billion against $27.57 billion in the same months of 2025, a rise of 12.6%. Exports grew only 1.9%, while imports grew 7.7%. So the gap widened mainly because Pakistan bought more, not because it sold less.
| Month | Exports 2025 | Exports 2026 | Imports 2025 | Imports 2026 |
|---|---|---|---|---|
| January | 2,951 | 3,055 | 5,869 | 5,805 |
| February | 2,490 | 2,276 | 5,339 | 5,290 |
| March | 2,645 | 2,264 | 5,278 | 5,103 |
| April | 2,174 | 2,468 | 6,098 | 6,731 |
| May | 2,671 | 2,689 | 5,662 | 5,454 |
| June | 2,477 | 2,242 | 5,359 | 6,899 |
| July | 2,683 | 2,951 | 5,837 | 6,898 |
| August | 2,416 | 2,532 | 5,288 | 5,824 |
| September | 2,499 | 2,961 | 5,848 | 6,492 |
All figures are in $ million. The first half of 2026 was weak for exports, with February, March and June below 2025. From July, exports picked up and beat 2025 in every month. Imports jumped in June and July, both around $6.9 billion.
Remittances paid for the whole goods gap
Overseas Pakistanis sent $32.72 billion home from January to September 2026, slightly more than the $31.06 billion goods deficit. That money, not exports, is what keeps the gap from draining the country's dollars. It is why remittances matter so much to the rupee.
The month-by-month remittance figures are in Pakistan's remittances for 2026. The wider picture, which adds services, profits and interest, is the current account, covered in the September current account deficit. The State Bank's figures differ a little from PBS, because the two count trade at different points.
What a wide trade gap means for your household
A trade deficit is not a bill that families pay directly. But it shapes three things you do feel: the rupee, prices of imported goods, and the jobs that depend on exports. Here is how, in plain terms.
- The rupee. More imports means more demand for dollars. If remittances and loans do not cover it, the rupee weakens and imported goods get dearer. In 2026 the rupee actually gained a little, while remittances kept pace with the gap.
- Petrol, cooking oil and phones. Fuel, palm oil and machinery are among the biggest imports. Their rupee price follows world prices and the dollar rate.
- Jobs. Textile mills, rice millers and other exporters are large employers. Export growth of 1.9% this year leaves little room for new hiring in those trades.
- Interest rates. The State Bank watches the external accounts when it sets interest rates, and higher rates slow borrowing for imports. It raised its policy rate to 12% on 27 October.
The dollar's path through the year is in the dollar rate for every month of 2026. Which goods drove the import rise is broken down in Pakistan's imports by product.
How to read the trade figures on the PBS website
PBS posts a free summary every month, usually in the first days of the next month. It also posts detailed export and import sheets by product. These steps take about five minutes.
- Open pbs.gov.pk and go to External Trade Statistics.
- Download the "Revised Summary" spreadsheet for the month you want.
- Table 1 shows the month against the month before. The earlier month is marked F, for final.
- Table 2 shows the month against the same month a year earlier.
- Table 3 shows the fiscal year so far, from July.
Use the figure marked F where you can. A new month's figure is marked P, for provisional, or R, for revised, and usually changes a little later.
Common questions
What is Pakistan's trade deficit in 2026?
$31.06 billion in goods from January to September 2026, on PBS figures. Exports were $23.44 billion and imports $54.50 billion.
Which month had the biggest trade deficit in 2026?
June, at $4.66 billion. Imports were $6.90 billion that month and exports only $2.24 billion.
Did Pakistan's exports grow in 2026?
Slightly. They were 1.9% higher than in the same nine months of 2025, with most of the growth from July onward.
When will October 2026 trade figures come out?
PBS usually posts them in the first days of the following month. September's came on 2 October. They were not up when we checked on 4 November.
Why do PBS and State Bank trade figures differ?
PBS counts goods when they clear customs. The State Bank counts them when payment moves through banks. So the two totals differ a little.
How we verified this
What we checked, where we read it, and what we could not confirm.
Last checked 4 November 2026 at about 06:00 PKT. We read the PBS external trade statistics page and downloaded the revised monthly summaries for January to September 2026, including the September 2026 summary. Each month's final figure comes from the following month's summary. The 2025 comparison is PBS's own year-earlier figure in each summary. Totals, ratios and percentages are our own arithmetic. The remittance total comes from State Bank figures recorded on our remittances page.
About the author

Global Affairs & Political Economy Writer
Muhammad Hatim is a book lover who started writing because he enjoys it. At Pakistan Era he writes about international relations, geopolitics and the global economy, with a particular interest in South Asia and the forces behind current events.