Weekly Inflation in Pakistan 2026: Every Week's SPI Change From PBS, February to October (Full List)
Every weekly SPI change in Pakistan for 2026 from PBS, 12 February to 29 October: the latest -0.35%, the 1.93% peak, monthly trends and how to check it.
Latest: weekly inflation in Pakistan, measured by the Sensitive Price Indicator (SPI), fell 0.35% in the week to 29 October 2026, after a 0.65% rise the week before. Below is every week's change PBS shows for 2026, from 12 February to 29 October, in one list.
The SPI is a weekly price check by the Pakistan Bureau of Statistics (PBS). It tracks 51 everyday items, such as flour, chicken, tomatoes, LPG and petrol, in 17 cities, and compares their prices with the week before. A plus figure means prices rose that week. A minus figure means they fell.
We took every figure from the SPI chart on the PBS home page on 5 November 2026. The chart shows the combined week-on-week change for 36 weeks. We cross-checked three of them against the PBS weekly releases we reported at the time, and they matched.
Weekly inflation fell 0.35% in the latest week, to 29 October 2026
The SPI dropped 0.35% in the week to 29 October 2026, its second fall in three weeks. Against the same week of 2025, prices were 11.32% higher, PBS said. Prices had risen 0.65% the week before, on 22 October, after a tiny 0.04% dip on 15 October.
Our report on that week, weekly inflation for 29 October 2026, lists which items moved, including the 35% jump in tomato prices.
The next figure covers the week to Thursday 5 November 2026. PBS normally releases it on the Friday that follows.
Every week of 2026: the full SPI list
PBS's chart lists 36 weeks, newest first below. Two weeks have no entry in the chart, the weeks to 28 May and 25 June 2026, and the chart starts on 12 February, so January is not in it.
| Week ending | Change on previous week | Direction |
|---|---|---|
| 29 October 2026 | -0.35% | Down |
| 22 October 2026 | +0.65% | Up |
| 15 October 2026 | -0.04% | Down |
| 8 October 2026 | +0.57% | Up |
| 1 October 2026 | +0.21% | Up |
| 24 September 2026 | +0.99% | Up |
| 17 September 2026 | +0.49% | Up |
| 10 September 2026 | +0.23% | Up |
| 3 September 2026 | +0.65% | Up |
| 27 August 2026 | +0.05% | Up |
| 20 August 2026 | +0.49% | Up |
| 13 August 2026 | +0.15% | Up |
| 6 August 2026 | +0.28% | Up |
| 30 July 2026 | -0.91% | Down |
| 23 July 2026 | +0.91% | Up |
| 16 July 2026 | +1.40% | Up |
| 9 July 2026 | -0.45% | Down |
| 2 July 2026 | -0.98% | Down |
| 18 June 2026 | +0.46% | Up |
| 11 June 2026 | +0.16% | Up |
| 4 June 2026 | -0.56% | Down |
| 21 May 2026 | -0.33% | Down |
| 14 May 2026 | +0.47% | Up |
| 7 May 2026 | +0.79% | Up |
| 30 April 2026 | +0.62% | Up |
| 23 April 2026 | -0.33% | Down |
| 16 April 2026 | -0.69% | Down |
| 9 April 2026 | +1.93% | Up |
| 2 April 2026 | +1.01% | Up |
| 26 March 2026 | +0.97% | Up |
| 19 March 2026 | +0.21% | Up |
| 12 March 2026 | +1.89% | Up |
| 5 March 2026 | +0.37% | Up |
| 26 February 2026 | -0.54% | Down |
| 19 February 2026 | +1.16% | Up |
| 12 February 2026 | -0.59% | Down |
Out of 36 weeks listed, prices rose in 25 and fell in 11. No week showed exactly zero.
March and September saw the fastest price rises
Chaining the weekly changes month by month shows March 2026 as the worst month, with prices up about 3.5% across its four listed weeks. September came next at about 2.4%, then April at about 2.5% over five weeks.
| Month | Weeks listed | Chained change |
|---|---|---|
| February 2026 | 3 | +0.02% |
| March 2026 | 4 | +3.48% |
| April 2026 | 5 | +2.54% |
| May 2026 | 3 | +0.93% |
| June 2026 | 3 | +0.06% |
| July 2026 | 5 | -0.05% |
| August 2026 | 4 | +0.97% |
| September 2026 | 4 | +2.38% |
| October 2026 | 5 | +1.04% |
These are our own sums, made by compounding the PBS weekly figures. They are a guide to the trend, not an official monthly number. For the official monthly figure use the Consumer Price Index (CPI), which PBS puts at 9.6% for October 2026 in our October 2026 inflation report.
Across all 36 listed weeks, the chained rise is about 11.9%. Because two weeks are missing, treat that as a rough figure.
The biggest single week was 9 April 2026, up 1.93%
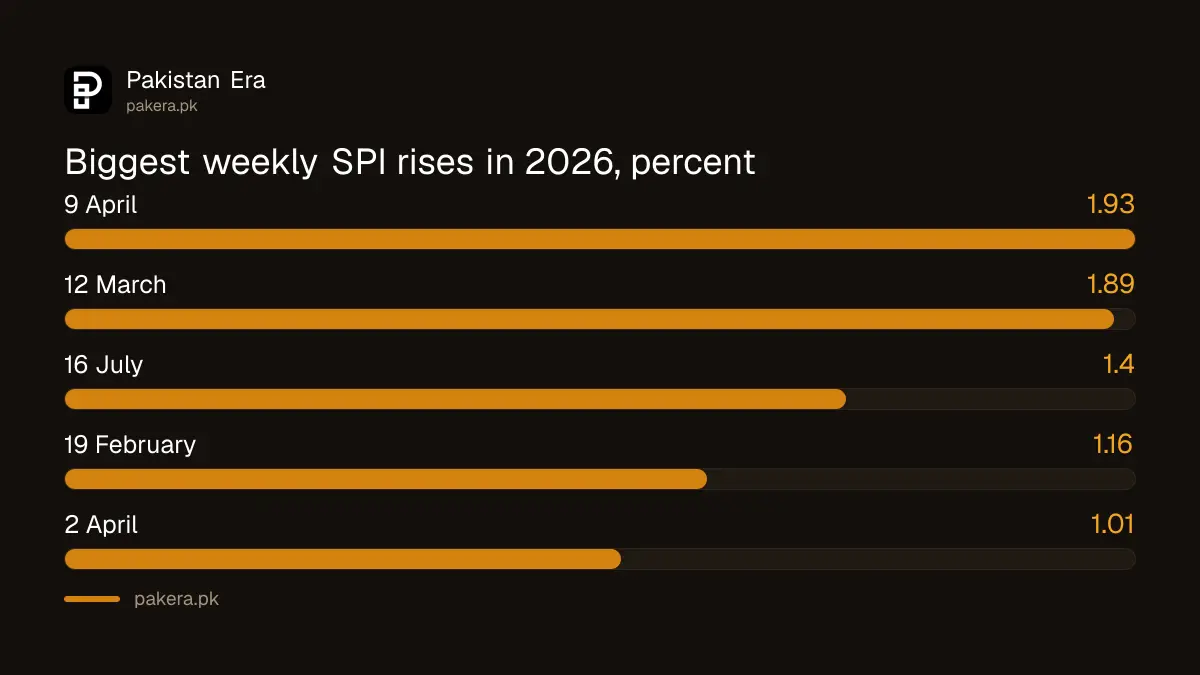
The sharpest weekly rise came in the week to 9 April 2026, when the SPI jumped 1.93%. The week to 12 March 2026 was close behind at 1.89%. The biggest fall was 0.98% in the week to 2 July 2026.
- Biggest rises: 9 April (+1.93%), 12 March (+1.89%), 16 July (+1.40%), 19 February (+1.16%), 2 April (+1.01%).
- Biggest falls: 2 July (-0.98%), 30 July (-0.91%), 16 April (-0.69%), 12 February (-0.59%), 4 June (-0.56%).
Big weekly jumps usually come from a few volatile items, such as tomatoes, onions, chicken or LPG, rather than from all 51 items at once.
How to check the new SPI figure yourself
You can read each week's SPI on the PBS site for free in about a minute. The home page chart updates with each release, and the full PDF lists every item's price.
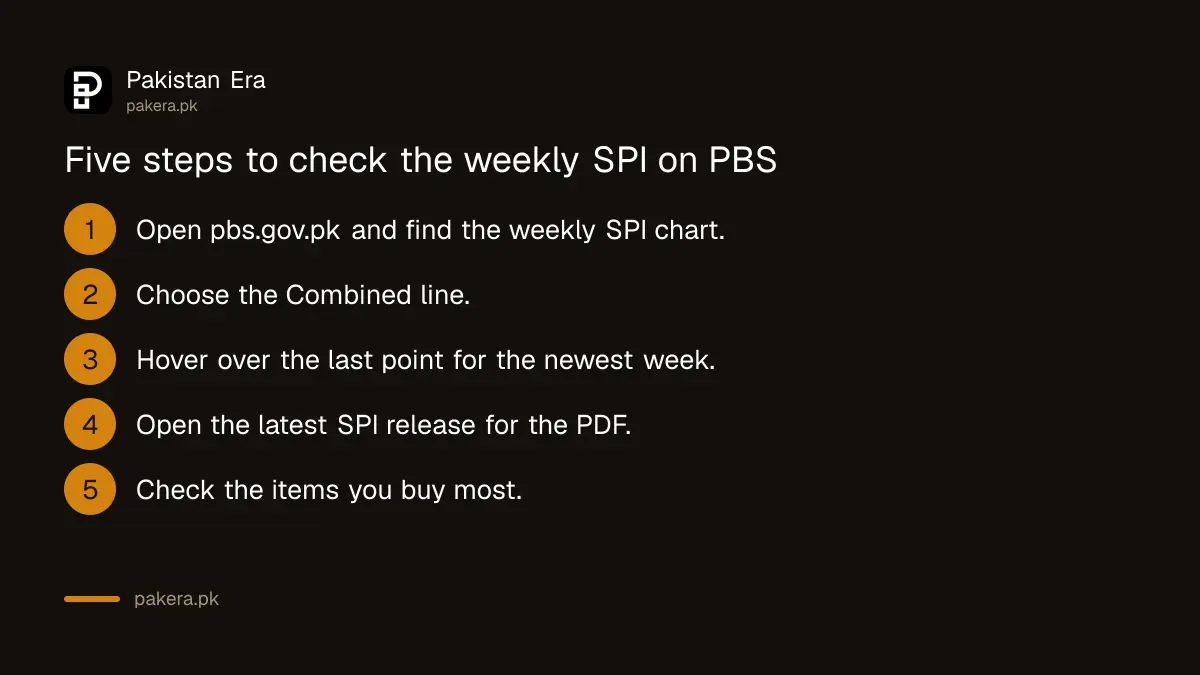
- Open pbs.gov.pk and scroll to the weekly SPI chart.
- Choose the "Combined" line to see the headline weekly change.
- Hover over the last point to read the newest week.
- Open "Weekly Sensitive Price Indicator (SPI)" in the latest releases for the PDF.
- Check the item table for the goods you buy most.
The SPI also has lines for five income groups, from the lowest to the highest earners. Our guide on reading the SPI by income group explains those lines.
Common questions
What is the SPI in Pakistan?
The Sensitive Price Indicator, a weekly PBS index of 51 essential items in 17 cities. It shows how prices changed against the previous week.
What was weekly inflation on 29 October 2026?
The combined SPI fell 0.35% in the week to 29 October 2026, according to PBS.
Which week had the highest SPI rise in 2026?
The week to 9 April 2026, with a 1.93% rise, followed by the week to 12 March 2026 at 1.89%.
Is the SPI the same as the inflation rate?
No. The official inflation rate is the monthly CPI, which covers a much wider basket. The SPI is a faster weekly signal for essential items only.
Why are some weeks missing?
The PBS chart has no entry for the weeks to 28 May and 25 June 2026. We list only what PBS shows and have not filled the gaps.
How we verified this
What we checked, where we read it, and what we could not confirm.
Last checked 5 November 2026. Source: Pakistan Bureau of Statistics, weekly SPI chart, "% Change of SPI Index with Base 2015-16 [WoW]", combined series, on the PBS home page (pbs.gov.pk). Monthly chained figures are our own calculation from those weekly values.
About the author

Global Affairs & Political Economy Writer
Muhammad Hatim is a book lover who started writing because he enjoys it. At Pakistan Era he writes about international relations, geopolitics and the global economy, with a particular interest in South Asia and the forces behind current events.