How to Read PBS's Weekly SPI by Income Group in Pakistan: 9.41% to 12.48% on the Year
PBS's weekly SPI for 8 October 2026 was 372.58, up 11.97% on a year, from 9.41% for the lowest spending group to 12.48% for the top. See how to read your row.
Short answer: PBS's weekly Sensitive Price Indicator (SPI) for the week ended 8 October 2026 was 372.58 for all households, up 0.57 per cent on the week and 11.97 per cent on a year ago. The lowest spending group had a lower rise on the year, 9.41 per cent. The highest group had the highest, 12.48 per cent.
A headline inflation number treats every household as the same. The Pakistan Bureau of Statistics (PBS) does not. Each week it prints the SPI for five spending groups, side by side. We opened PBS's executive summary for the week ended 8 October 2026 and read the table so you can find your own row.
The SPI follows 51 items in 17 cities and splits households into five groups
PBS says the SPI covers 51 essential items collected from 50 markets in 17 cities. The base is 2015-16, set at 100. PBS splits households into five spending groups, called quintiles, and also gives one combined figure. The indicator is meant to show price moves over a short period.
| Group | Spending band (Rs) | SPI, 8 Oct | Change on week | Change on year |
|---|---|---|---|---|
| Q1 | Up to 17,732 | 356.56 | 0.52% | 9.41% |
| Q2 | 17,733 to 22,888 | 360.08 | 0.54% | 11.17% |
| Q3 | 22,889 to 29,517 | 380.67 | 0.53% | 9.78% |
| Q4 | 29,518 to 44,175 | 368.09 | 0.57% | 10.21% |
| Q5 | Above 44,175 | 372.43 | 0.60% | 12.48% |
| Combined | All | 372.58 | 0.57% | 11.97% |
PBS gives the bands as expenditure in rupees. The table we opened does not label them as monthly, though we read them that way. Our report on weekly inflation for 8 October covers the same week item by item.
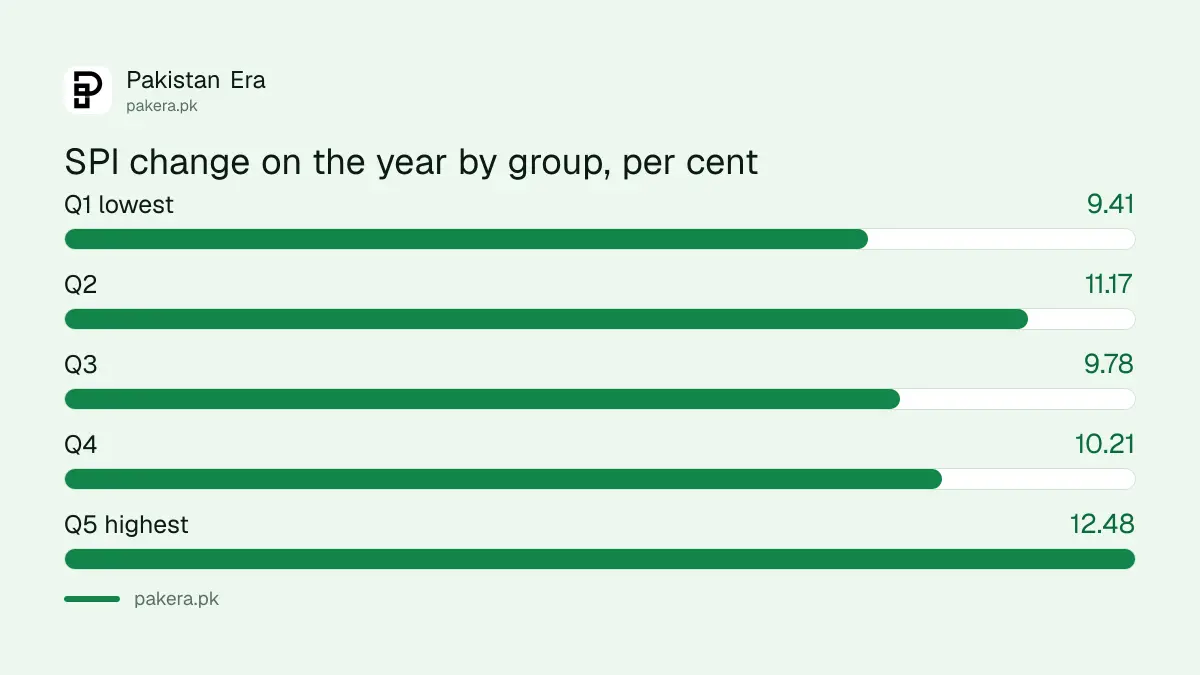
The SPI level and the SPI rise are two different things
The level, such as 380.67 for Q3, only compares a group with its own past. It does not mean Q3 pays more than Q1. The useful column is the change. Over a year, prices in the Q5 basket rose 12.48 per cent and in the Q1 basket 9.41 per cent.
The gap is 3.07 percentage points, our arithmetic. PBS's table does not explain it in the summary we read. The weights give one clue, in the next section. We do not claim they explain the whole gap.
Flour weighs more in the poorest basket and petrol weighs less
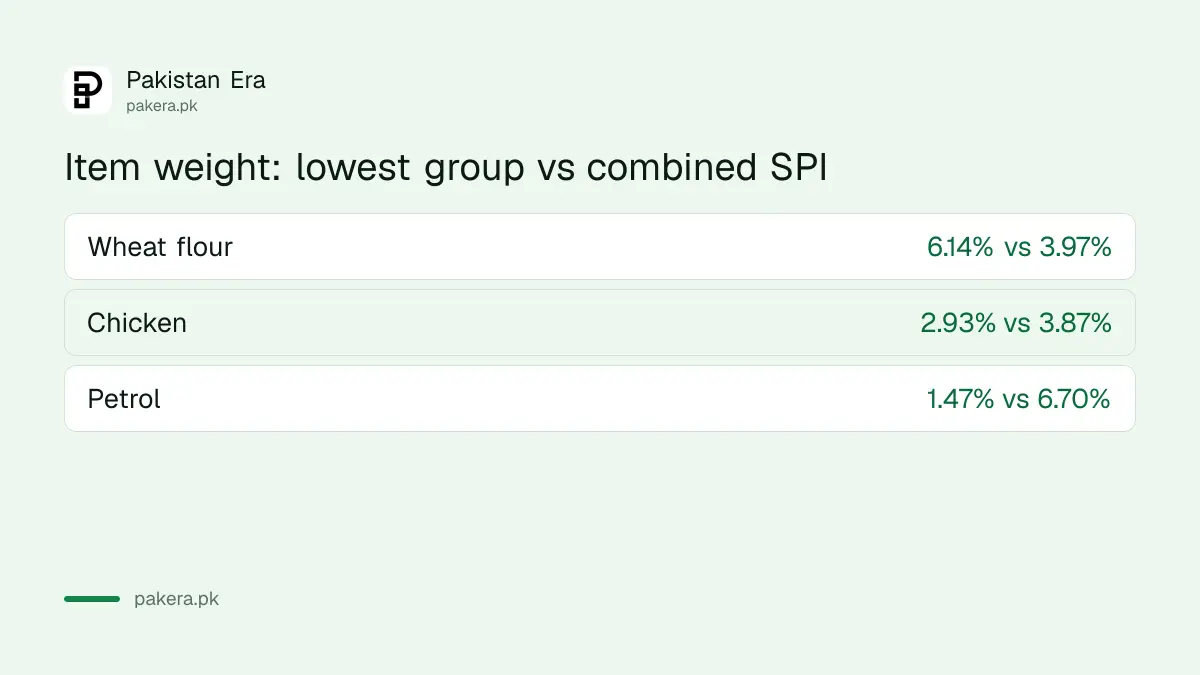
PBS prints how much each item counts in the lowest group and in the combined index. Wheat flour counts for 6.1372 per cent of the lowest group's basket and 3.9725 per cent of the combined one. Petrol is the other way: 1.4673 per cent in the lowest group against 6.7018 per cent combined.
| Item | Price 8 Oct | Change on week | Change on year | Weight, lowest group | Weight, combined |
|---|---|---|---|---|---|
| Wheat flour, 20 kg bag | Rs 2,851.04 | 5.69% | 32.60% | 6.1372% | 3.9725% |
| Chicken, live broiler, kg | Rs 383.31 | 4.93% | 9.44% | 2.9269% | 3.8681% |
| Petrol super, litre | Rs 398.87 | 2.40% | 47.52% | 1.4673% | 6.7018% |
So a week with flour up 5.69 per cent hits a Q1 household harder than a Q5 household, and a petrol rise hits the other way. This is how the weights work. It is not a statement about any one family's bills. To work out your own basket, see how to calculate what the rupee is worth after inflation.
Five weeks of the lowest group and the combined SPI
PBS also prints a ten-week trend. Here are the latest five weeks. The combined SPI rose every week. The lowest group fell in two of them, the weeks ended 10 and 17 September.
| Week ended | Lowest group SPI | Combined SPI | Combined, change on year |
|---|---|---|---|
| 10 September 2026 | 351.56 | 364.26 | 8.62% |
| 17 September 2026 | 351.07 | 366.05 | 10.64% |
| 24 September 2026 | 354.06 | 369.69 | 11.92% |
| 1 October 2026 | 354.73 | 370.46 | 11.53% |
| 8 October 2026 | 356.56 | 372.58 | 11.97% |
The weekly SPI differs from the monthly consumer price index, the CPI, which is the headline inflation rate. For the difference, read CPI, SPI and WPI explained. The latest monthly rate is in our report on September 2026 inflation.
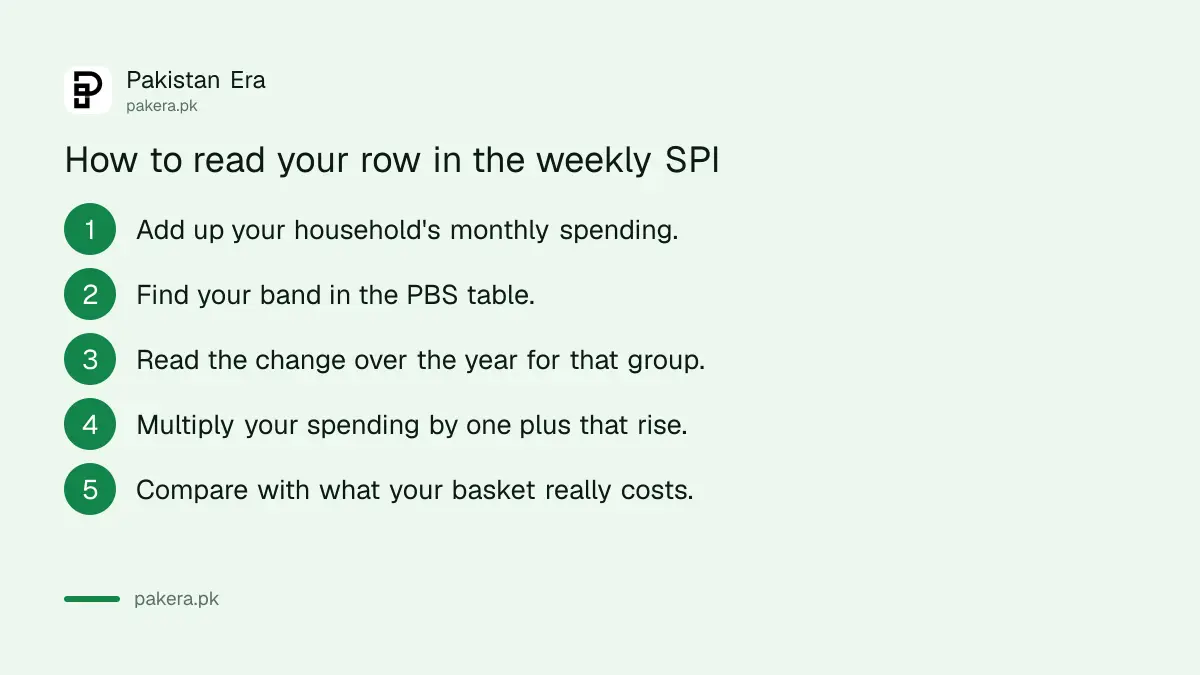
How to find your group and read your row in five steps
You only need your household's spending. Pick the band it falls in and read that row each week. The example below is only an illustration, not a forecast of your own prices.
- Add up your household's spending for a typical month.
- Find the band that contains it in PBS's table.
- Read the "change over 09-10-25" column for that group, the year-on-year rise.
- Multiply your spending by one plus that rise. At 11.17 per cent, Rs 20,000 becomes Rs 22,234.
- Compare the result with what your own basket really costs now.
Common questions about the weekly SPI
What was the weekly SPI on 8 October 2026?
The combined SPI was 372.58, up 0.57 per cent on the week and 11.97 per cent on a year earlier, per PBS.
What is a quintile in the SPI?
It is one of five household groups ranked by spending. Q1 is the lowest group, spending up to Rs 17,732, and Q5 is the highest, above Rs 44,175.
Which group saw the biggest rise over the year?
The highest group, Q5, at 12.48 per cent. The lowest group, Q1, had the smallest rise at 9.41 per cent.
Is the SPI the same as inflation?
No. The SPI is a weekly gauge of 51 items. The headline inflation rate is the monthly CPI. They can move differently.
How many items and cities does the SPI cover?
PBS says 51 essential items, collected from 50 markets in 17 cities.
Where do I find the latest SPI?
On the PBS website. Each week the bureau posts a release page with an executive summary PDF and a city-wise annex.
How we verified this
What we checked, where we read it, and what we could not confirm.
Last checked 15 October 2026. All SPI figures, item prices, weights and the ten-week trend come from the PBS executive summary and release page for the week ended 8 October 2026, which we opened on PBS's weekly SPI page on 15 October 2026. The 3.07 point gap and the Rs 22,234 example are our own arithmetic. A newer weekly release may have been posted since this was written.
About the author

Global Affairs & Political Economy Writer
Muhammad Hatim is a book lover who started writing because he enjoys it. At Pakistan Era he writes about international relations, geopolitics and the global economy, with a particular interest in South Asia and the forces behind current events.