Pakistan's 4 Inflation Numbers Explained: CPI 10.3%, SPI 11.97%, WPI 13.3%, Core 8.6%
CPI, SPI, WPI and core inflation measure different things in Pakistan. See what each covers, the latest PBS figures and which one to use for pay, food or rates.
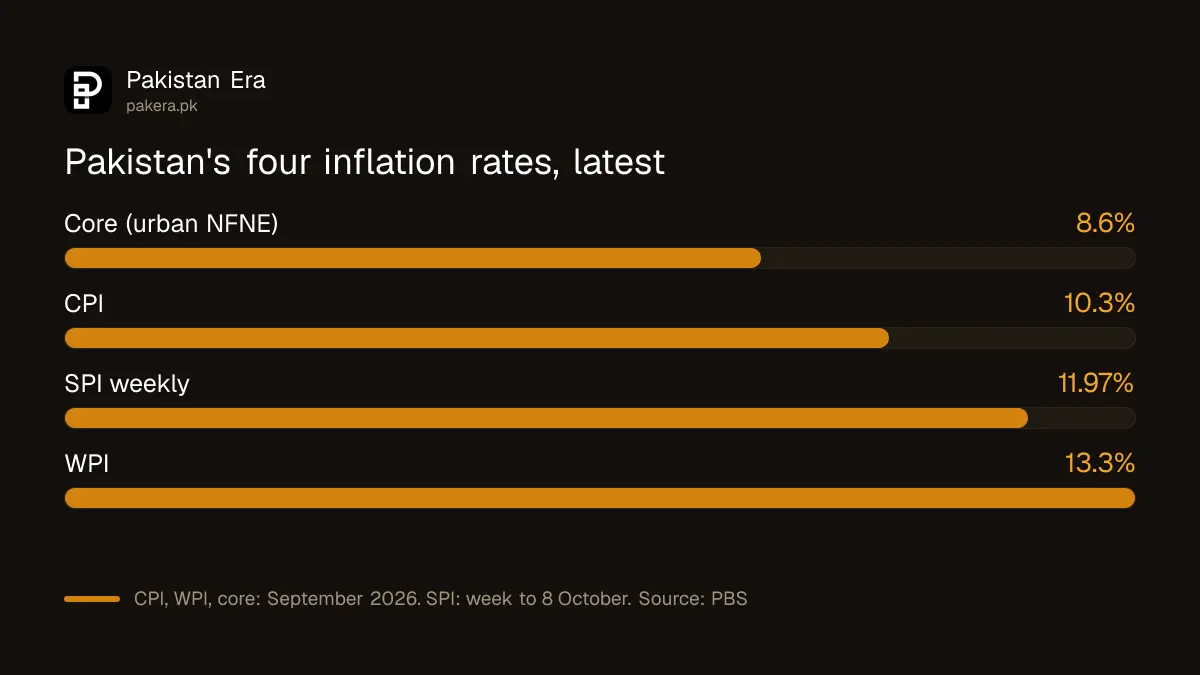
Pakistan publishes four inflation numbers, and right now they disagree. CPI inflation was 10.3 per cent in September 2026. The weekly SPI was up 11.97 per cent on the year in the week to 8 October. Wholesale prices were up 13.3 per cent, and core inflation was 8.6 per cent in cities.
None of them is wrong. Each measures a different basket over a different period. This explainer sets out what each one covers, which one to use for a salary talk, a grocery budget or a business plan, and why the gap between them matters for the next few months.
The CPI is the headline number and covers the whole household budget
The Consumer Price Index (CPI) is the main inflation figure. The Pakistan Bureau of Statistics (PBS) publishes it once a month, and it covers everything a typical household buys, from flour to rent, school fees and bus fares. In September 2026 it was up 10.3 per cent on a year earlier.
PBS publishes a national CPI, plus separate urban and rural versions. In September 2026 urban CPI rose 10.1 per cent and rural CPI 10.5 per cent. Food carries more weight in the rural basket, so food price swings hit villages harder.
When the government, the State Bank of Pakistan (SBP) or a news report says "inflation", it almost always means this number. It is the right one for salary talks, pension reviews and rent increases. The full breakdown is in our report on Pakistan's inflation in September 2026.
The SPI tracks 51 essentials every week
The Sensitive Price Indicator (SPI) is a weekly check on 51 essential items, collected from 50 markets in 17 cities. It moves fast and is dominated by food and fuel. In the week ended 8 October 2026 it rose 0.57 per cent, and stood 11.97 per cent above the same week of 2025.
Because the SPI has no rent, school fees or doctor's bills, it is a grocery and kitchen number. It tells you quickly when flour, onions or LPG are jumping. In that same week wheat flour rose 5.69 per cent and chicken 4.93 per cent.
PBS also splits the SPI into five spending groups, from the lowest-spending households (Q1) to the highest (Q5). The yearly rise was 9.41 per cent for Q1 and 12.48 per cent for Q5 that week. Our weekly SPI report for 8 October lists every item that moved.
One trap: the monthly review also gives an SPI figure, 8.4 per cent for September. That is a month average compared with a month a year earlier, so it will not match a single week's 11.97 per cent.
The WPI shows what shops will pay before you do
The Wholesale Price Index (WPI) measures prices between businesses, before goods reach the shop shelf. It rose 13.33 per cent in the year to September 2026 and 1.88 per cent in that month alone. A wholesale rise usually reaches retail prices with a delay.
The wholesale jump is led by fuel and wheat. On the year to September 2026, PBS listed kerosene up 78.93 per cent, diesel oil up 61.45 per cent, wheat up 44.49 per cent and wheat flour up 39.13 per cent at wholesale.
WPI running about 3 points above CPI is a warning sign. It suggests that shopkeepers and factories are still absorbing some cost increases that may pass to buyers in the coming months. Traders and small manufacturers should watch this number more than the CPI.
Core inflation strips out food and energy to show the trend
Core inflation removes the most volatile prices, food and energy, to show the steady underlying trend. PBS gives two versions. On the "non-food non-energy" measure, urban core inflation was 8.6 per cent in September 2026 and rural 8.1 per cent.
The second version, the trimmed mean, drops the 20 per cent of items with the most extreme price moves each month. It stood at 9.4 per cent in both urban and rural areas in September.
The SBP watches core inflation closely because interest rates work slowly and cannot fix a one-off spike in onion prices. In its 14 September statement it said higher transport costs had pushed core inflation to 8.7 per cent. A rising core number makes a rate rise more likely. A falling one gives room to hold or cut. That is worth keeping in mind before the next SBP monetary policy meeting.
Use the right number for the job
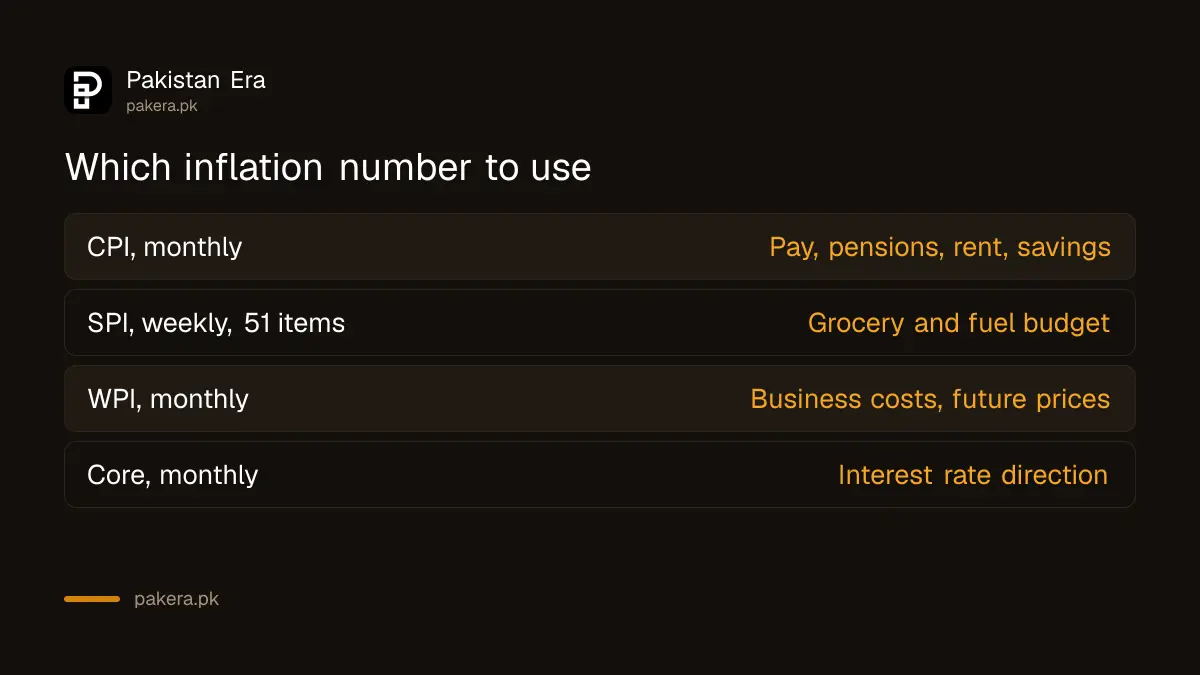
Pick the measure that matches your question. The CPI fits pay and rent, the SPI fits the kitchen budget, the WPI fits business costs, and core inflation fits interest rate decisions. The table puts them side by side.
| Measure | How often | What it covers | Latest figure | Best used for |
|---|---|---|---|---|
| CPI | Monthly | Whole household budget, urban and rural | 10.3% (September 2026) | Salaries, pensions, rent, savings |
| SPI | Weekly | 51 essentials, 50 markets, 17 cities | 11.97% (week to 8 October) | Grocery and fuel budget |
| WPI | Monthly | Wholesale prices between businesses | 13.3% (September 2026) | Business costs, future shop prices |
| Core (NFNE) | Monthly | CPI without food and energy | 8.6% urban (September 2026) | Interest rate direction |
To read them yourself, follow these steps:
- Open the PBS website home page. The latest monthly inflation report and the latest weekly SPI are listed under recent releases.
- For CPI, WPI and core, download the Monthly Review on Price Indices. The first page, "Inflation in Brief", has all three.
- For the SPI, open the weekly executive summary, released each Friday for the week ending Thursday.
- Always note the period. A weekly year-on-year figure and a monthly one will rarely match.
Common questions
What is the difference between CPI and SPI in Pakistan?
The CPI is a monthly measure of the whole household budget. The SPI is a weekly measure of 51 essential items in 17 cities, mostly food and fuel.
Which inflation figure is the official rate?
The national CPI. It was 10.3 per cent year on year in September 2026, according to PBS.
Why is the SPI higher than the CPI right now?
The SPI is mostly food and fuel, and those rose faster than rent, education and other services. Onions, LPG, petrol and flour led the yearly rise in the week to 8 October 2026.
What does a high WPI mean for consumers?
Wholesale costs are rising faster than shop prices. Some of that 13.3 per cent rise may reach retail prices in the coming months.
What is core inflation in Pakistan?
Inflation without food and energy. Urban core inflation was 8.6 per cent and rural 8.1 per cent in September 2026 on the PBS non-food non-energy measure.
How we verified this
What we checked, where we read it, and what we could not confirm.
Last checked 10 October 2026, about 8:30 pm PKT. CPI, WPI and core figures are from the PBS Monthly Review on Price Indices for September 2026. SPI figures are from the PBS executive summary for the week ended 8 October 2026. The core inflation remark from the SBP is from its monetary policy statement of 14 September 2026. The comparison table is our own.
About the author

Global Affairs & Political Economy Writer
Muhammad Hatim is a book lover who started writing because he enjoys it. At Pakistan Era he writes about international relations, geopolitics and the global economy, with a particular interest in South Asia and the forces behind current events.