Pakistan Inflation Eases to 10.3% in September 2026 as Electricity Jumps 15%
Pakistan's CPI inflation eased to 10.3% in September 2026 from 11.1%, PBS says, but prices rose 1.3% in a month. Urban, rural, core and the biggest movers.
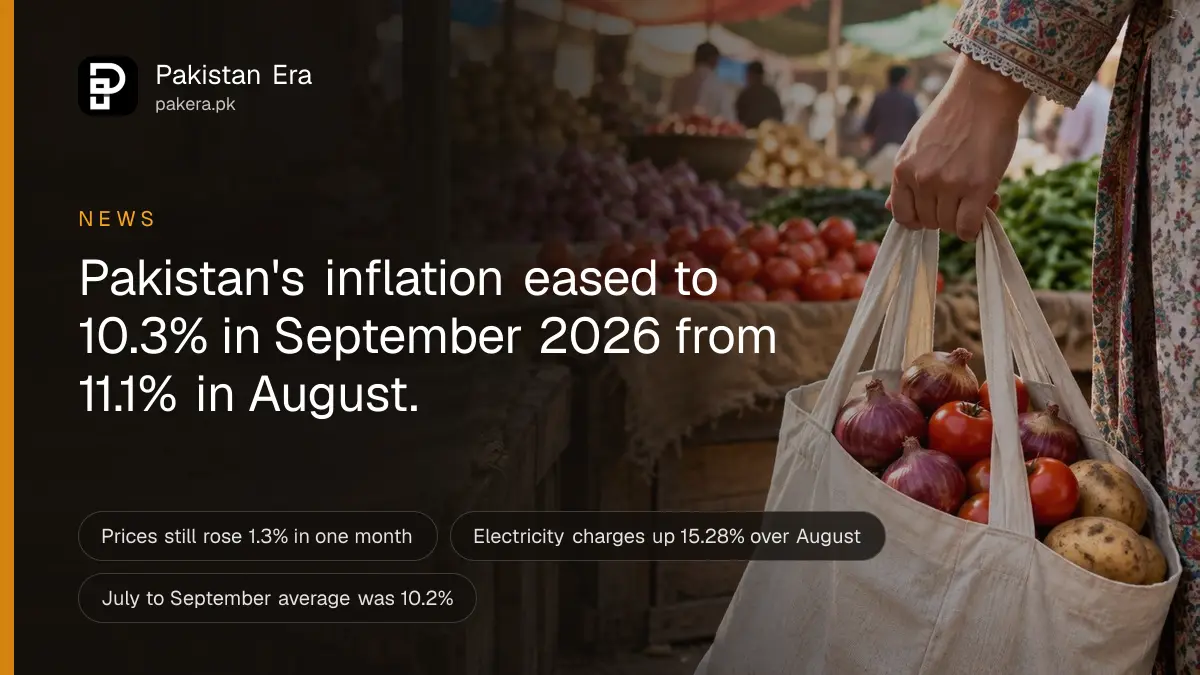
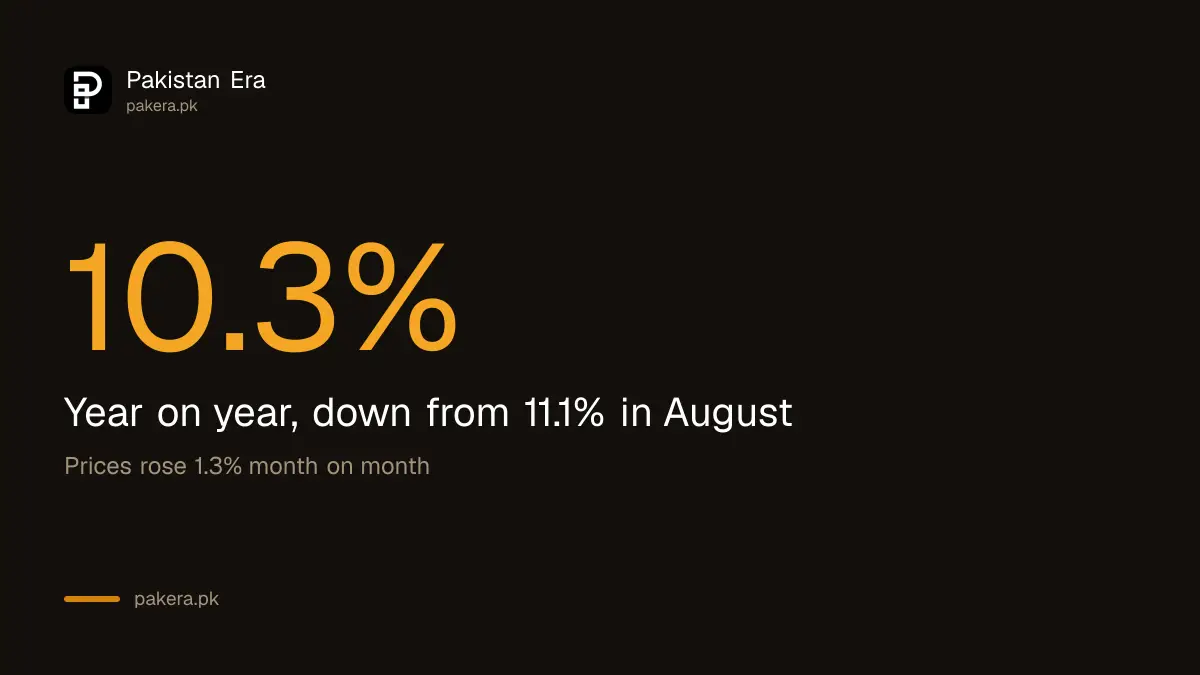
Pakistan's inflation eased to 10.3% in September 2026, down from 11.1% in August, the Pakistan Bureau of Statistics (PBS) said on 1 October. Prices still rose 1.3% in a single month. Electricity charges jumped 15.28% and motor fuel 10.76% over August, while food prices hardly moved.
Update, 11 October 2026: The Finance Division has published its September 2026 economic update.
Update, 10 October 2026: Want to see what your rupees are worth now? We built a worked guide. See how to calculate it.
We read the full PBS Monthly Review on Price Indices for September 2026 on the day it came out. The headline rate fell for the first time since July. But the monthly rise of 1.3% was slightly faster than August's 1.2%. So the pace of yearly inflation slowed, while bills kept climbing.
Inflation fell to 10.3% in September 2026
CPI inflation, the main measure of how fast prices rise, was 10.3% year on year in September 2026. It was 11.1% in August and 5.8% in September 2025. Month on month, prices rose 1.3%, against 1.2% in August.
The exact figure in PBS's national index is 10.26%. Analysts had expected a reading between 10.25% and 10.75%, so the result landed at the bottom of that range.
The rate is still about double where it stood a year ago. The State Bank's medium-term target is 5% to 7%. Inflation has now been above 10% in five of the last six months, every month since April 2026 except July.
| Measure | September 2026 | August 2026 | September 2025 |
|---|---|---|---|
| National CPI, year on year | 10.3% | 11.1% | 5.8% |
| National CPI, month on month | 1.3% | 1.2% | 2.1% |
| Urban CPI, year on year | 10.1% | 10.4% | 5.7% |
| Rural CPI, year on year | 10.5% | 12.2% | 5.9% |
| Core inflation, urban (non-food non-energy) | 8.6% | 8.8% | 7.0% |
| Core inflation, rural (non-food non-energy) | 8.1% | 8.5% | 7.8% |
| Wholesale prices (WPI), year on year | 13.3% | 11.8% | 0.6% |
Cities and villages both saw a slower yearly rise
Urban inflation slowed to 10.1% from 10.4%. Rural inflation fell more sharply, to 10.5% from 12.2%. Month on month, prices rose 1.3% in cities and 1.2% in villages, so the monthly squeeze was almost the same everywhere.
The rural drop is the bigger story. Food carries more weight in the rural basket, about 41% against about 30% in cities. Rural food prices rose 7.7% over the year, down from 13.2% in August. That pulled the rural rate down fast.
Non-food prices went the other way. They rose 11.5% in cities and 13.1% in villages over the year. Month on month, non-food prices rose 2.0% in cities and 2.1% in villages.
Electricity and fuel drove the monthly rise
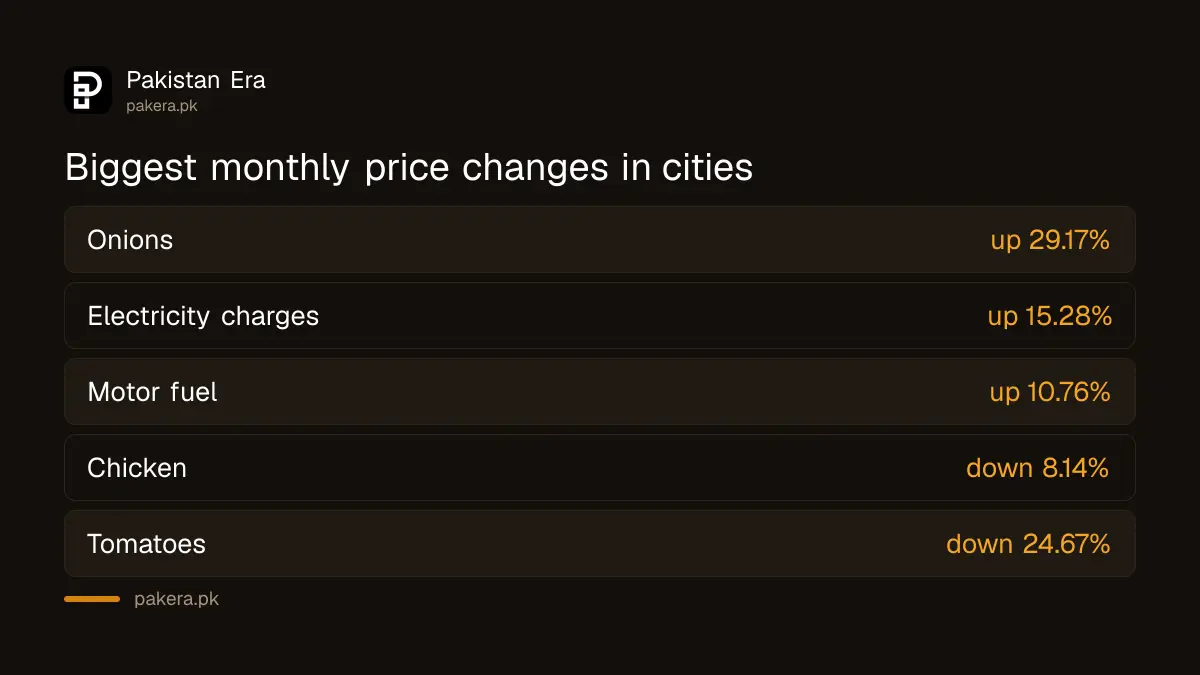
Electricity charges rose 15.28% in one month in both cities and villages, PBS said. Motor fuel rose 10.76% in cities and 11.13% in villages. The transport group as a whole rose 5.75%, the largest monthly jump of any group.
PBS also shows how much each group added to the 1.27% national monthly rise. The top three were:
- Housing, water, electricity, gas and fuels: up 3.05%, adding 0.64 percentage points. It is about 24% of the basket.
- Transport: up 5.75%, adding 0.43 points.
- Food and soft drinks: up 0.19%, adding just 0.07 points.
PBS does not give reasons for price changes. But September bills carried the Rs 2.58 a unit electricity increase that NEPRA approved for fuel and quarterly adjustments. Petrol and diesel also rose during the month, and the weekly price figures for late September showed the same pressure building.
Onions up, tomatoes and chicken down
Food prices rose only 0.19% nationally in September. Inside that small number, onions jumped 29.17% in cities and 39.38% in villages, while tomatoes fell 24.67% in cities and chicken fell 8.14%. Wheat and flour kept rising.
Over the full year, the gaps are wide. These are the urban year-on-year changes PBS listed:
- Onions: up 125.48%.
- Wheat: up 40.96%. Wheat flour: up 31.71%.
- Meat: up 14.68%. Fresh milk: up 8.16%.
- Potatoes: down 30.34%. Chicken: down 20.92%.
- Eggs: down 20.19%. Sugar: down 19.94%.
For non-food items in cities, LPG (liquified hydrocarbons) was up 57.14% on the year, motor fuel 37.73% and electricity 32.46%. Transport services were up 29.56%.
July to September average reached 10.2%
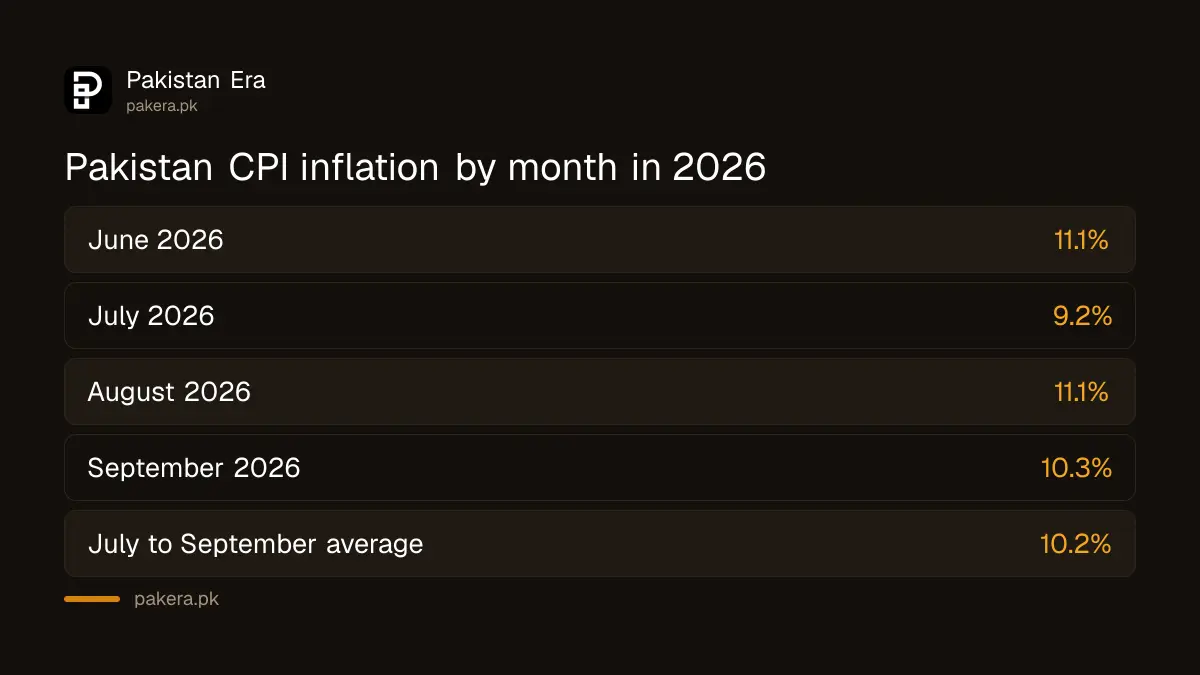
Average inflation for the first quarter of fiscal year 2026-27, July to September, was 10.20%. In the same three months last year it was 4.30%. Urban inflation averaged 9.75% and rural 10.87% over the quarter, according to PBS's Table 1.1.
The quarter ran 9.2% in July, 11.1% in August and 10.3% in September. So September undid only part of August's jump.
Wholesale prices are a warning sign. The WPI, which tracks prices before goods reach shops, rose 13.3% on the year, up from 11.8%. Diesel at wholesale was up 61.45% and kerosene 78.93%. Wholesale costs often reach shop shelves later.
What the September figure means for you
The yearly rate fell, but prices did not. A household basket that cost Rs 10,000 in September 2025 cost about Rs 11,026 in September 2026, based on PBS's national index. Most of September's new pressure came through power bills and fuel.
The State Bank held its policy rate at 11.5% in September, citing inflation of 11.1% in August. With core inflation at 8.6% in cities and the headline rate above 10%, the case for a rate cut has not grown much stronger. The State Bank's September decision named wheat, perishables, energy and transport as the main inflation drivers, and energy and transport led this report.
Common questions
What is Pakistan's inflation rate for September 2026?
10.3% year on year, according to PBS. It was 11.1% in August 2026.
Did prices go down in September 2026?
No. Prices rose 1.3% from August. Only the yearly rate of increase slowed.
What is core inflation in September 2026?
Non-food non-energy core inflation was 8.6% in cities and 8.1% in villages, both a little lower than in August.
Why did inflation rise month on month?
Mainly electricity, up 15.28%, and motor fuel, up about 11%. Food prices rose only 0.19%.
What was average inflation from July to September 2026?
10.20%, against 4.30% in the same quarter of the previous year.
Is inflation higher in cities or villages?
Slightly higher in villages: 10.5% against 10.1% in cities in September 2026.
How we verified this
What we checked, where we read it, and what we could not confirm.
Last checked on 1 October 2026, shortly after release. We read PBS's Monthly Inflation Report for Sep 2026 and the attached Monthly Review on Price Indices, September 2026 (base year 2015-16), including Table 1.a, Table 1.b, Table 1.1, the group tables for national, urban and rural CPI and the lists of main price changes. The August 2026 comparison figures come from the same review and from the August 2026 report. The Rs 11,026 basket figure is our arithmetic on PBS's national index. The expected range of 10.25% to 10.75% is what analysts forecast before the release; it is not a PBS figure. PBS does not give reasons for price changes, so the link to the electricity adjustment is our reading.
About the author

Tax, Bills and Technology Writer
Ali Akhtar is a young and curious voice here at Pakistan Era. He is currently pursuing his A-Levels and has a growing interest in Pakistan’s changing industrial landscape and educational trends. Ali likes to write in a way that helps him explain and explore the world around him. His writing reflects the perspective of the new generation navigating the evolving trends of Pakistan where technology, youth innovation, and shifting opportunities are reshaping the country’s future.