Islamabad Air Quality in October 2026: Unhealthy on 16 of 31 Days, PM2.5 Over the Limit on 28, Pak-EPA Reports
Pak-EPA's October 2026 report: Islamabad's PM2.5 averaged 54.6 against a limit of 35, over it on 28 days, Unhealthy on 16. Worst day, every 2026 month compared.
Short answer: Islamabad's air was Unhealthy on 16 of the 31 days of October 2026, according to the Pakistan Environmental Protection Agency (Pak-EPA). Fine dust, PM2.5, averaged 54.6 micrograms per cubic metre for the month, against a national limit of 35. It was over the limit on 28 days.
Those figures come from Pak-EPA's monthly report, "Ambient Air Quality Data with AQI of Islamabad (October, 2026)", posted on its Ambient Air Quality Data page. It gives one row for every day of the month, with four pollutants and an AQI for each.
October was much worse than September. The monthly PM2.5 average rose from 41.7 to 54.6, about 31 per cent higher, by our arithmetic. Only three days stayed under the limit, all in the middle of the month.
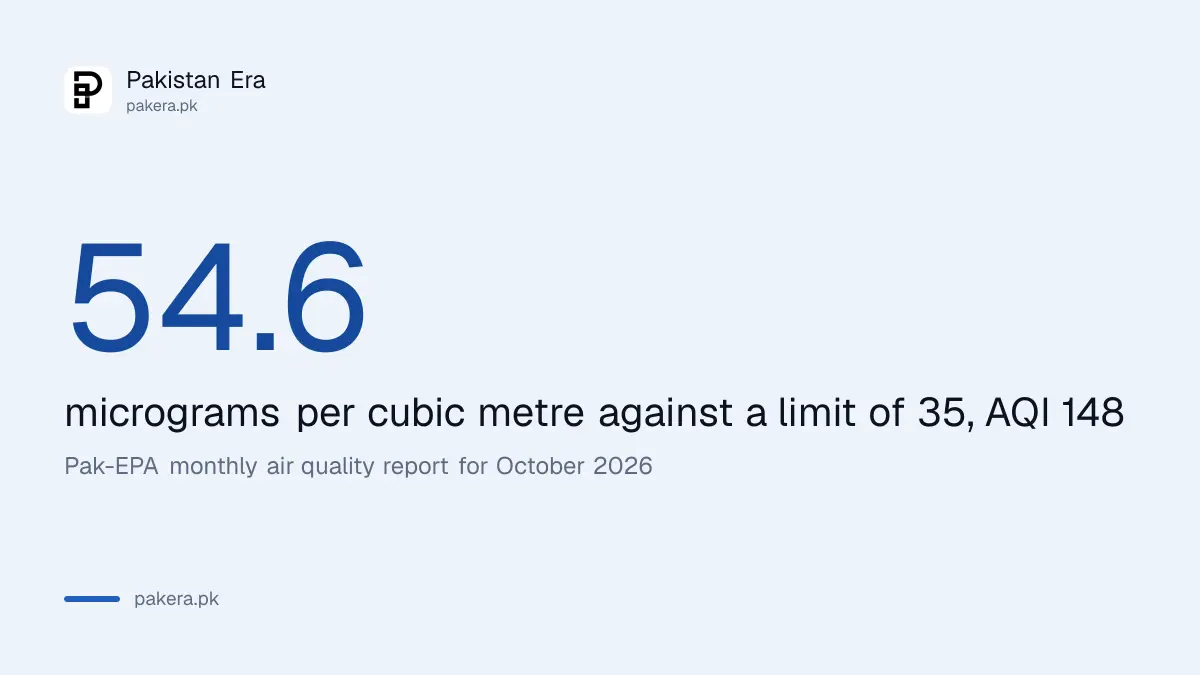
PM2.5 averaged 54.6 in October, 1.6 times the limit of 35
Pak-EPA put Islamabad's October PM2.5 average at 54.6, with a monthly AQI of 148, Unhealthy for Sensitive Groups. The National Environmental Quality Standard (NEQS) for PM2.5 is 35, so the month ran about 1.6 times the limit.
PM2.5 means dust and smoke particles smaller than 2.5 micrometres. They reach deep into the lungs and can pass into the blood. The other three pollutants Pak-EPA measures stayed Good every day of the month.
| Pollutant | October average | NEQS limit | Monthly AQI | Band |
|---|---|---|---|---|
| Sulphur dioxide (SO2) | 17.7 | 120 | 25 | Good |
| Carbon monoxide (CO) | 1,582.4 | 5,000 | 18 | Good |
| Nitrogen dioxide (NO2) | 8.9 | 80 | 8 | Good |
| Fine dust (PM2.5) | 54.6 | 35 | 148 | Unhealthy for Sensitive Groups |
All values are micrograms per cubic metre, as Pak-EPA prints them. Carbon monoxide still matters even in the Good band. Its October average was about a third higher than September's 1,162.5, and its highest daily averages came in the last week of the month.
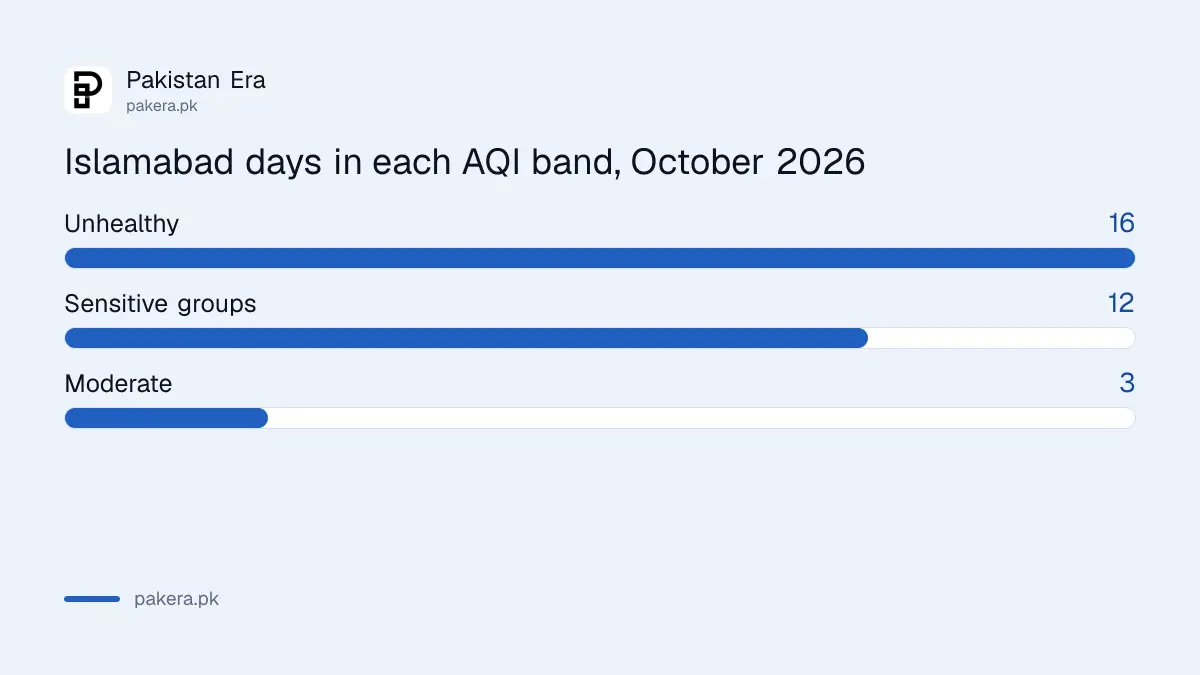
16 days were Unhealthy, 12 were Sensitive and 3 were Moderate
Pak-EPA's daily rows put 16 October days in the Unhealthy band, 12 in Unhealthy for Sensitive Groups (UFSG) and 3 in Moderate. No day was Good or Satisfactory. The three Moderate days were 12, 14 and 15 October.
| Part of October | PM2.5 average | Unhealthy days | Sensitive days | Moderate days |
|---|---|---|---|---|
| 1 to 10 October | 60.8 | 7 | 3 | 0 |
| 11 to 20 October | 44.1 | 2 | 5 | 3 |
| 21 to 31 October | 58.4 | 7 | 4 | 0 |
| Whole month | 54.6 | 16 | 12 | 3 |
The ten day averages are our own arithmetic from Pak-EPA's daily rows. The middle of the month was clearly better. The start and the end of October were both poor, and the last week led straight into the Unhealthy readings of early November.
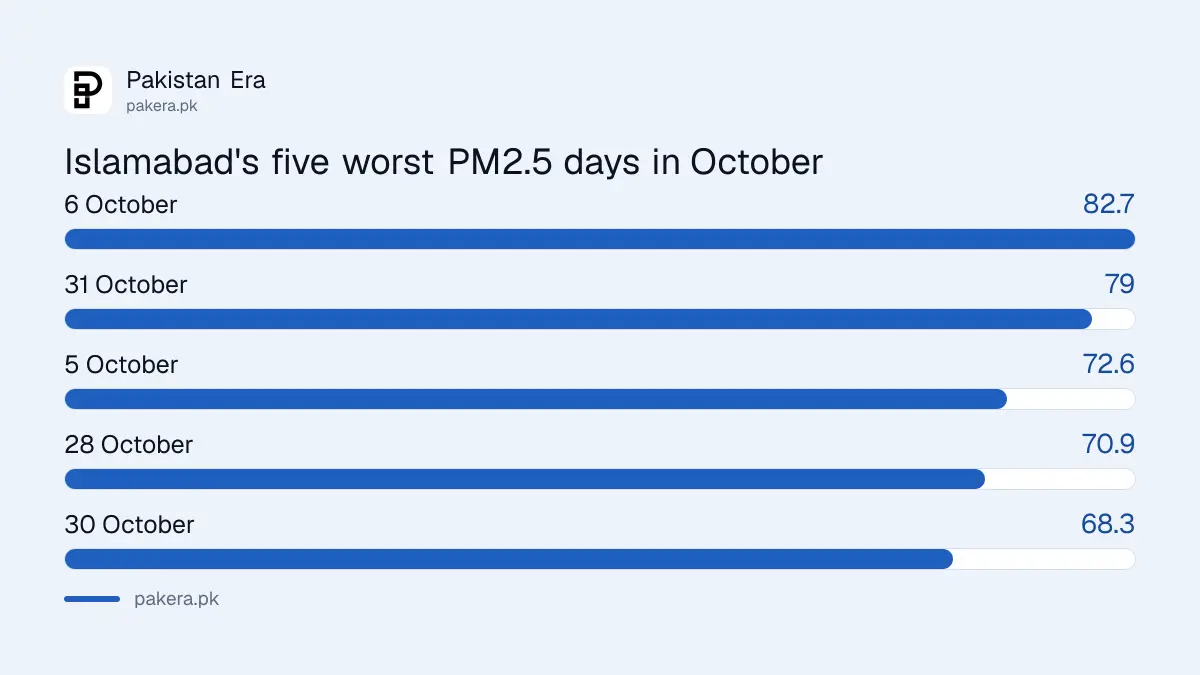
6 October was the worst day, at 82.7 and an AQI of 164
The single worst day was Tuesday 6 October, when PM2.5 averaged 82.7, about 2.4 times the limit. The AQI was 164. The 31st came close at 79, an AQI of 162. The cleanest day was 15 October, at 30.9.
| Worst days | PM2.5 | AQI |
|---|---|---|
| 6 October | 82.7 | 164 |
| 31 October | 79.0 | 162 |
| 5 October | 72.6 | 159 |
| 28 October | 70.9 | 158 |
| 30 October | 68.3 | 157 |
The longest Unhealthy run was seven days in a row, from 4 to 10 October. A second run of six days began on 26 October and lasted to the end of the month. Carbon monoxide had its highest daily average on 28 October, at 2,665.6.
October was Islamabad's third worst month of 2026 so far
Pak-EPA's monthly reports for 2026 give a PM2.5 AQI for each month. October's 148 is below January's 175 and February's 158, so it ranks third of the ten months published. The cleanest month was April, at 77.
| Month in 2026 | Monthly PM2.5 AQI | Band |
|---|---|---|
| January | 175 | Unhealthy |
| February | 158 | Unhealthy |
| March | 105 | UFSG |
| April | 77 | Moderate |
| May | 101 | UFSG |
| June | 96 | Moderate |
| July | 90 | Moderate |
| August | 90 | Moderate |
| September | 116 | UFSG |
| October | 148 | UFSG |
The pattern is clear. Islamabad's air is cleanest from April to August and worst from October to February. The daily tables for mid November, such as Islamabad AQI on 12 November, already sit in the Unhealthy band. The full September picture is in Islamabad air quality in September.
How to read Pak-EPA's monthly report yourself
Pak-EPA keeps its monthly reports, going back to May 2018, on one page, grouped by year. Each PDF has a row per day, with the 24 hour average for each pollutant and the AQI band printed underneath.
- Open environment.gov.pk and go to the Ambient Air Quality Data page under the CLEAN Laboratory section.
- Find the year, then open the month's PDF. The October 2026 file is the newest one.
- Read the NEQS row at the top. It gives the limits: 120 for SO2, 5,000 for CO, 80 for NO2 and 35 for PM2.5.
- Go down the PM2.5 column. Any value over 35 is over the limit.
- Read the band under each AQI. Unhealthy starts at 151 on Pak-EPA's table.
- Check the Average row at the bottom for the month as a whole.
Pak-EPA's tables carry a warning that any other data on Islamabad's air "is neither verified nor approved by the Pak EPA". Rawalpindi is in Punjab and is measured by Punjab EPA, explained in Rawalpindi AQI today. People with asthma or heart disease should follow the steps in NIH's smog advice for heart and asthma patients.
Common questions
How many days was Islamabad's air Unhealthy in October 2026?
Sixteen of 31 days, according to Pak-EPA's monthly report. Twelve more were Unhealthy for Sensitive Groups.
What was Islamabad's average PM2.5 in October 2026?
It was 54.6 micrograms per cubic metre, against a national limit of 35. The monthly AQI was 148.
Which day had the worst air in Islamabad in October?
6 October, when PM2.5 averaged 82.7 and the AQI was 164, Unhealthy.
Was October worse than September in Islamabad?
Yes. The PM2.5 average rose from 41.7 in September to 54.6 in October, and the monthly AQI from 116 to 148.
Which month of 2026 had Islamabad's worst air?
January, with a monthly PM2.5 AQI of 175. February was second at 158 and October third at 148.
Did any other pollutant cross the limit in October?
No. Sulphur dioxide, carbon monoxide and nitrogen dioxide were Good on every day.
How we verified this
What we checked and where we read it.
We read Pak-EPA's Ambient Air Quality Data page and its PDF "Ambient Air Quality Data with AQI of Islamabad (October, 2026)" on 17 November 2026, along with the monthly reports for January to September 2026 on the same page. The daily rows, the Average row and the NEQS limits are as Pak-EPA printed them. Pak-EPA's label on two days with an AQI of 150, 8 and 19 October, is Unhealthy, and we have kept its labels. The ten day averages, day counts, runs and the comparison with September are our own arithmetic. The January to April monthly reports give AQI figures only, without the PM2.5 concentrations.
About the author

Senior Writer, Public Services and Technology
Shahid joined us in 2024 as an author. He is a senior contributor to Pakistan's leading technology websites. He writes detailed articles, mostly covering his expertise in the latest tech, mobiles, apps, gadgets, and step-by-step guides. His ideology is to help people understand the latest trends and explain complex methods through very easy-to-understand guides.