Islamabad Air Quality in September 2026: PM2.5 Over the Limit on 23 of 30 Days, Pak-EPA Reports
Pak-EPA's September 2026 report puts Islamabad's PM2.5 at 41.7 against a limit of 35, over the line on 23 of 30 days and peaking at 56.7. See the worst days.
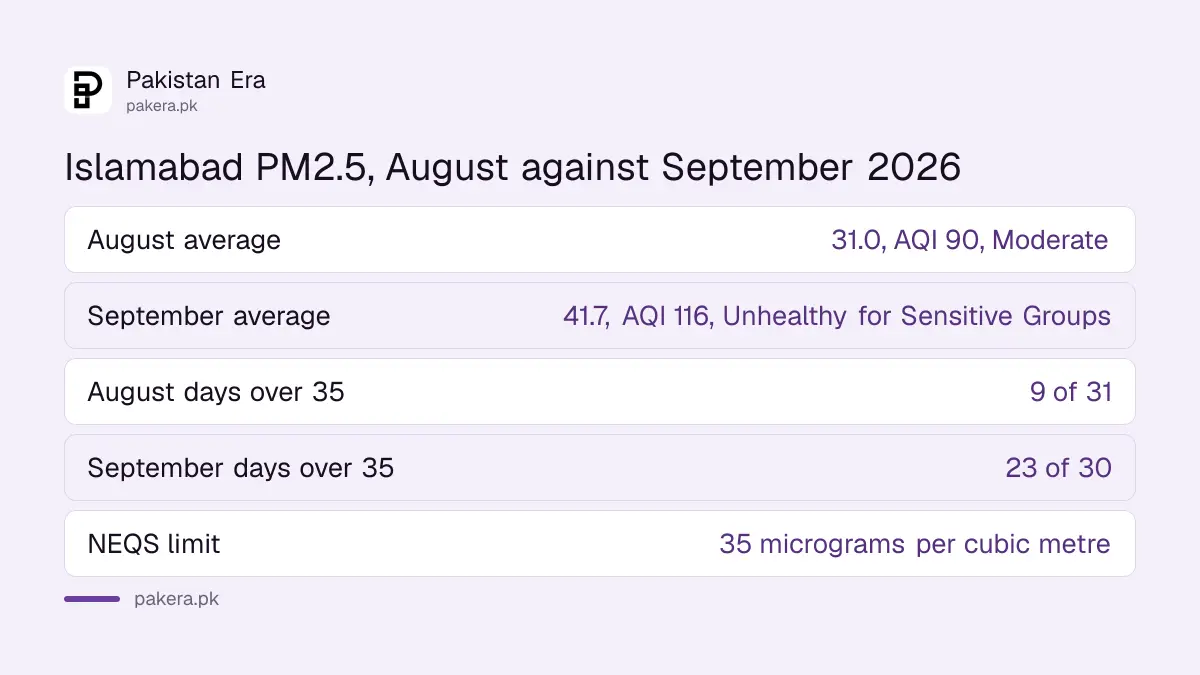
Islamabad's fine dust, PM2.5, was above the national limit of 35 micrograms per cubic metre on 23 of the 30 days of September 2026, according to the Pakistan Environmental Protection Agency's monthly air quality report. The monthly average was 41.7, an AQI of 116, which Pak-EPA labels Unhealthy for Sensitive Groups. The worst days were 22 and 23 September at 56.7, and the cleanest was 17 September at 22.6.
Pak-EPA is the federal agency, and its report covers the capital only. We read the September report, and the August one for comparison, on environment.gov.pk on 19 October 2026. The September file was posted on 7 October. The three gases the agency measures, sulphur dioxide, carbon monoxide and nitrogen dioxide, stayed in the Good band all month. The dust did not.
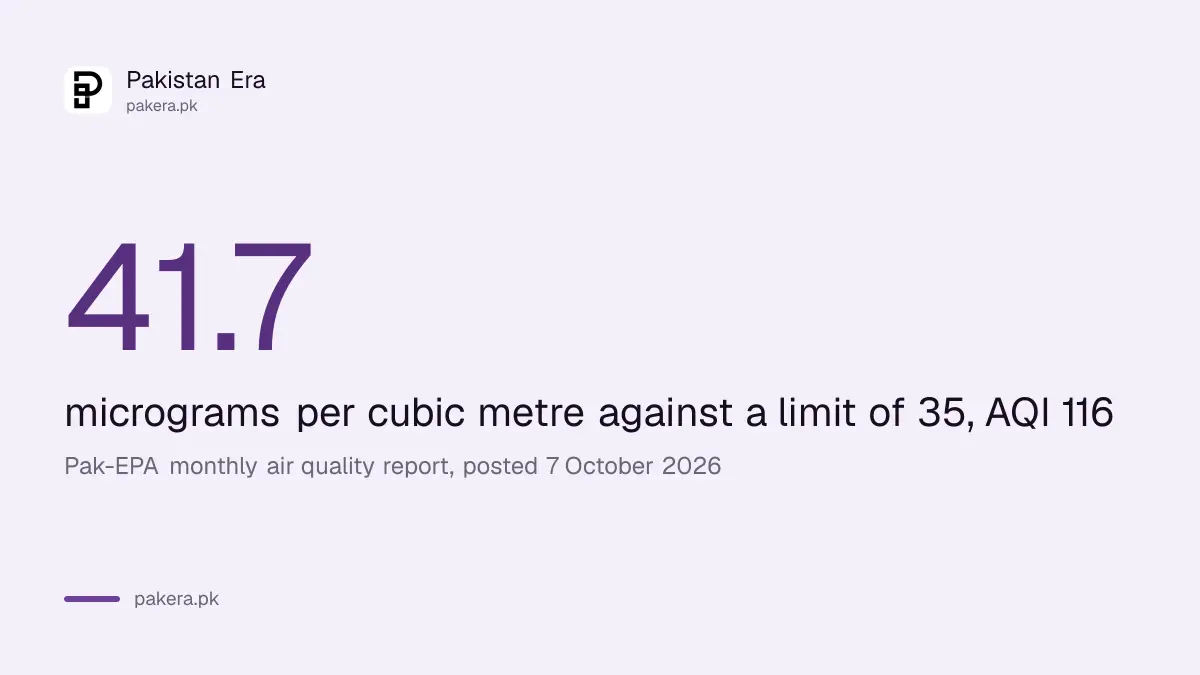
PM2.5 averaged 41.7 against a limit of 35
The report prints a daily reading for four pollutants and the National Environmental Quality Standard for each: 120 for sulphur dioxide, 5,000 for carbon monoxide, 80 for nitrogen dioxide and 35 for PM2.5, all in micrograms per cubic metre. September's averages were 17, 1,162.5, 7.4 and 41.7. Only PM2.5 was over its limit, and it was over by a fifth.
| Pollutant | NEQS limit | September 2026 average | AQI and band | August 2026 average |
|---|---|---|---|---|
| PM2.5 | 35 | 41.7 | 116, Unhealthy for Sensitive Groups | 31.0 |
| Sulphur dioxide | 120 | 17.0 | 24, Good | 16.4 |
| Carbon monoxide | 5,000 | 1,162.5 | 13, Good | 797.7 |
| Nitrogen dioxide | 80 | 7.4 | 7, Good | 5.0 |
August had been better. Its PM2.5 average was 31.0, under the limit, with an AQI of 90 in the Moderate band. By our count the August report shows 9 days over 35 out of 31, against 23 of 30 in September. Carbon monoxide also rose, from 797.7 to 1,162.5, though it stayed far below its 5,000 limit.
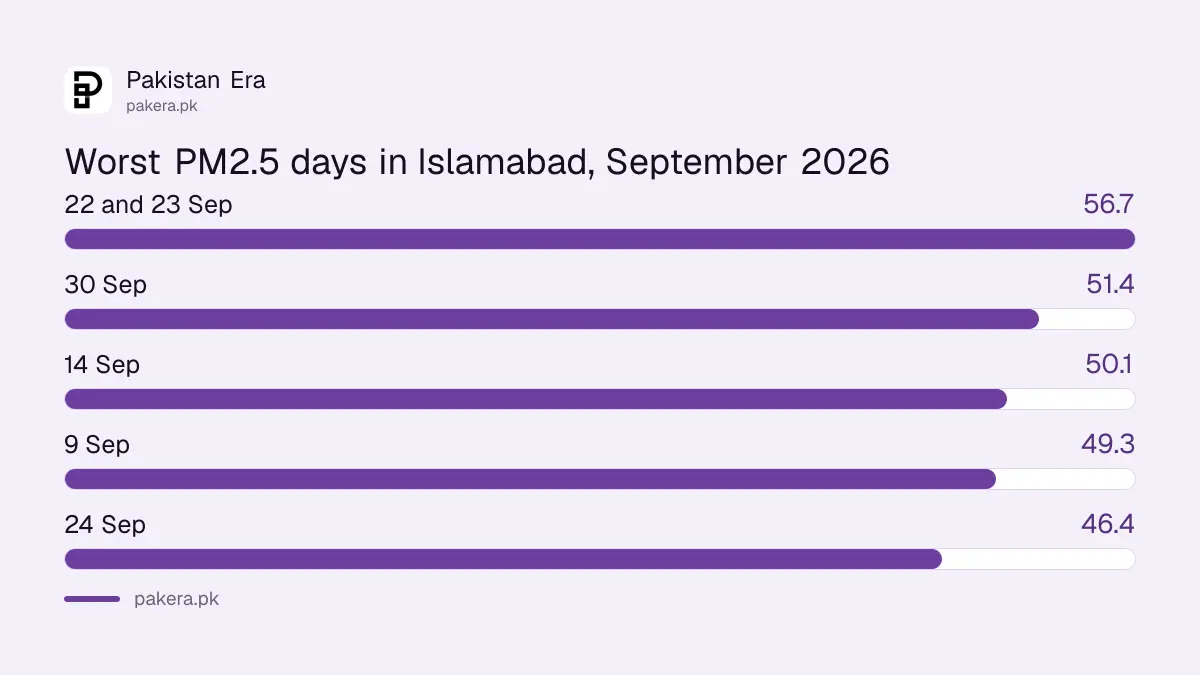
The dust rose through the month and peaked on 22 and 23 September
September started clean. The first two days read 25.4 and 27.4, under the limit. From 6 September the reading stayed above 35 on every day but three: 17 September at 22.6, 18 September at 34.5 and 25 September at 30.9. The two worst days, 22 and 23 September, both read 56.7 with identical figures for every pollutant, which looks like one day's data copied to the next; we flag it rather than treat it as two separate peaks.
| Date | PM2.5 | AQI | Pak-EPA band |
|---|---|---|---|
| 22 and 23 September | 56.7 | 151 | Unhealthy |
| 30 September | 51.4 | 140 | Unhealthy for Sensitive Groups |
| 14 September | 50.1 | 137 | Unhealthy for Sensitive Groups |
| 9 September | 49.3 | 135 | Unhealthy for Sensitive Groups |
| 24 September | 46.4 | 127 | Unhealthy for Sensitive Groups |
| 29 September | 46.2 | 127 | Unhealthy for Sensitive Groups |
| 17 September, cleanest | 22.6 | 73 | Moderate |
The month ended high. The last two days read 46.2 and 51.4, and the month's second-highest carbon monoxide reading, 2,007.8, fell on 29 September. That is the pattern that leads into smog season, when cooler, stiller air holds dust and smoke close to the ground. PMD's seasonal view, in its outlook for October to December 2026, expected a warmer, drier run into winter.
Pak-EPA's band names differ from Punjab's at the same number
An AQI of 116 is Unhealthy for Sensitive Groups in Pak-EPA's report but Moderate on Punjab's dashboard. Pak-EPA uses bands where 101 to 150 is Unhealthy for Sensitive Groups and 151 and above is Unhealthy. Punjab's site calls 101 to 150 Moderate and 151 to 200 Unhealthy for Sensitive Groups. The number is comparable; the word is not.
So a Rawalpindi reader looking at Punjab's dashboard, which showed Rawalpindi at 119 on the morning of 19 October, sees Moderate, while the same reading in the capital's report would be labelled Unhealthy for Sensitive Groups. Read the number, and use the health advice for your own condition. How the Punjab bands work, and the live Rawalpindi reading, are in the guide to checking air quality on Punjab's official site.
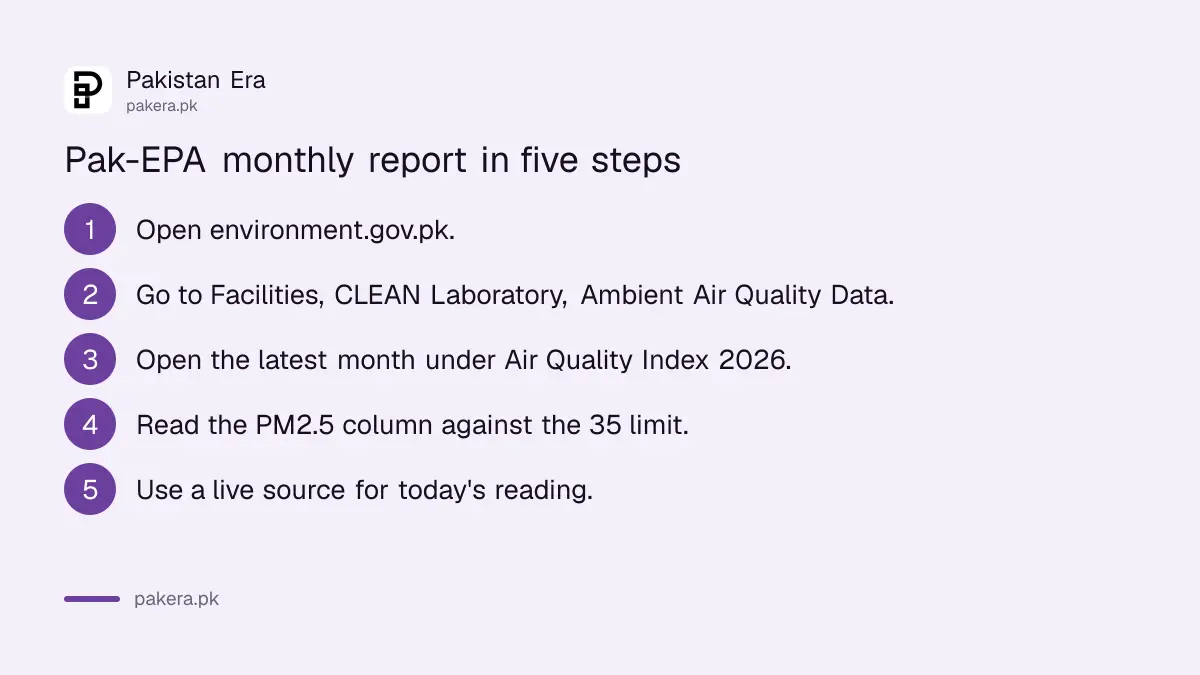
- Open environment.gov.pk and go to Facilities, CLEAN Laboratory, Ambient Air Quality Data.
- Pick the latest month under Air Quality Index 2026 and open the PDF.
- Read the PM2.5 column against the 35 limit; the gases are rarely the problem.
- Count the days over 35 for your own sense of the month, since the report gives only an average.
- For today's reading, use a live source; the monthly report arrives a week or more after the month ends.
What 41.7 means for a sensitive person in Islamabad
The Punjab EPA's advisory for the Unhealthy for Sensitive Groups band tells children, older people and anyone with asthma or heart or lung disease to avoid prolonged outdoor exertion and keep quick-relief medicine close. Pak-EPA's report carries no advice text, only the label. For a capital reader the practical rules are the same as in Lahore, set out in the guides to protecting children and older parents from smog and to N95 and KN95 masks.
Islamabad's September is nothing like Lahore's October. Lahore read 265 on the official dashboard at 3:00 am on 19 October, more than double the capital's worst September day. But the capital's trend is the same direction, and the September report is the last full-month official measure before the season turns.
What the report does not say
It does not name the monitoring site, so we cannot say which part of the city the readings represent. It gives no reason for the rise and no comparison with September 2025. It prints a monthly average but not the number of days over the limit; the 23 of 30 count is ours. The duplicated 22 and 23 September rows are unexplained. Pak-EPA's other recent public notice, on PET bottles in the capital, is in our report on Pak-EPA's statement that PET bottles are not banned.
Common questions
What was Islamabad's air quality in September 2026?
PM2.5 averaged 41.7 micrograms per cubic metre, above the 35 limit, giving an AQI of 116, Unhealthy for Sensitive Groups, in Pak-EPA's monthly report.
How many days were over the limit?
23 of 30 by our count of the daily PM2.5 readings in the report. August had 9 of 31.
What was the worst day?
22 and 23 September, both printed at 56.7 and an AQI of 151, Unhealthy. The two rows are identical, which we flag.
Where does Pak-EPA publish the report?
On environment.gov.pk under Facilities, CLEAN Laboratory, Ambient Air Quality Data. The September 2026 file was posted on 7 October 2026.
Is Islamabad's AQI scale the same as Punjab's?
The numbers compare, but the band names differ. 101 to 150 is Unhealthy for Sensitive Groups at Pak-EPA and Moderate on Punjab's dashboard.
Were the gases a problem?
No. Sulphur dioxide, carbon monoxide and nitrogen dioxide all stayed in the Good band every day of September.
How we verified this
What we checked, where we read it, and what we could not confirm.
Last checked 19 October 2026. All daily and average readings, the NEQS limits and the band labels come from Pak-EPA's "Ambient Air Quality Data with AQI of Islamabad" reports for September 2026 and August 2026, listed on the agency's Ambient Air Quality Data page, read on 19 October 2026. The counts of days over 35, the ranking of days and the comparison with August are our arithmetic. The Punjab band names and the Rawalpindi and Lahore readings are from aqi.punjab.gov.pk on 19 October. We could not verify the monitoring location or the reason for the duplicated 22 and 23 September rows.
About the author

Senior Writer, Public Services and Technology
Shahid joined us in 2024 as an author. He is a senior contributor to Pakistan's leading technology websites. He writes detailed articles, mostly covering his expertise in the latest tech, mobiles, apps, gadgets, and step-by-step guides. His ideology is to help people understand the latest trends and explain complex methods through very easy-to-understand guides.