Pakistan's Factory Output Rose 0.67% in August 2026: Petrol Refining Up 40%, Ghee Down 17%, PBS Data
Pakistan's LSM output rose 0.67% in August 2026 and 1.85% over July and August, PBS says. See which of 123 products grew or fell, from cars to cooking oil.
Short answer: Pakistan's large scale manufacturing (LSM) output rose 0.67 per cent in August 2026 against August 2025, the Pakistan Bureau of Statistics (PBS) says. It fell 4.96 per cent from July. For July and August together, output is up 1.85 per cent. Refineries, cars, motorcycles and garments grew, while food, chemicals, medicines and steel shrank.
LSM is the monthly measure of what big factories produce, from cooking oil to cars. PBS released the August figures in mid October. We read the PBS summary and the full product table, which lists 123 items, so this page goes beyond the headline to show what was actually made.
Factory output rose 0.67 per cent in August 2026
The PBS index for August 2026 is 113.19, against 112.45 in August 2025, a rise of 0.67 per cent. It is 4.96 per cent below July's 119.10. Over July and August, the index averaged 116.14, up 1.85 per cent on the same months of 2025.
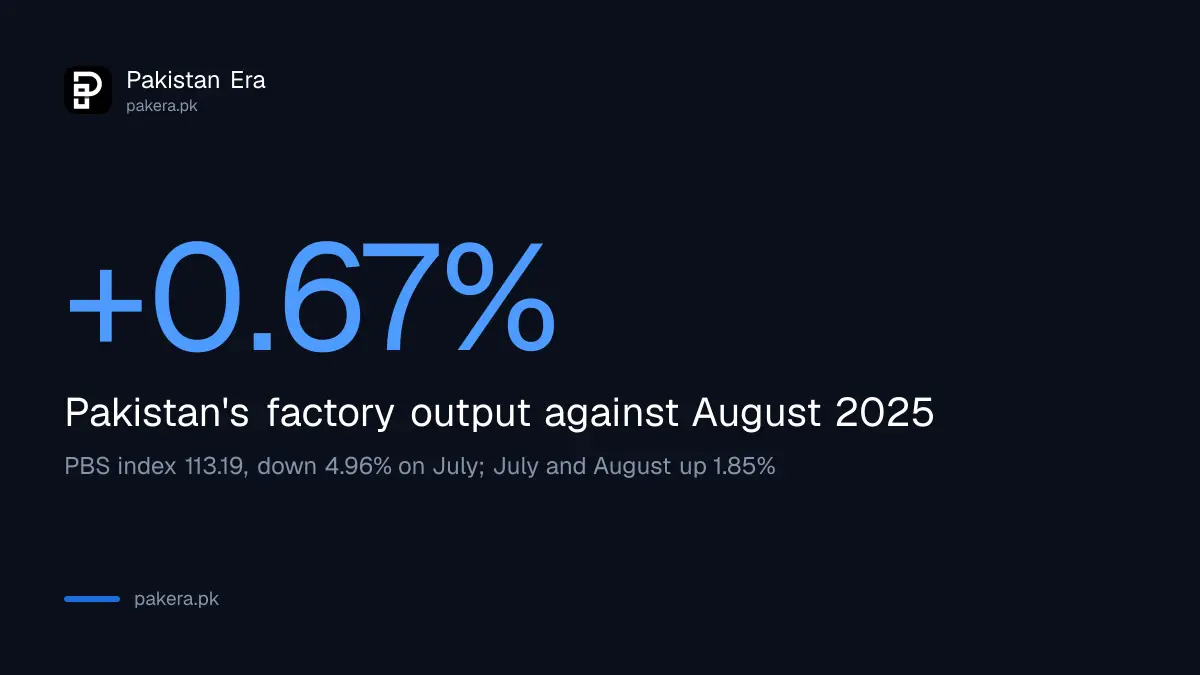
| Measure | Figure |
|---|---|
| LSM index, August 2026 | 113.19 |
| LSM index, July 2026 | 119.10 |
| LSM index, August 2025 | 112.45 |
| Change on August 2025 | +0.67% |
| Change on July 2026 | -4.96% |
| July and August 2026, change on a year earlier | +1.85% |
The index uses 2015-16 as its base of 100. PBS now shows July at 119.10, a touch below the 119.13 it first published, which is normal for provisional data. The first July release is in our July 2026 LSM figures.
Refineries made 40.65 per cent more petrol than a year ago
Refinery output was the standout. Petroleum products rose 31.85 per cent on August 2025. Petrol output was 357.3 million litres, up 40.65 per cent. Diesel was 631.1 million litres, up 31.57 per cent, and furnace oil rose 69.75 per cent.
| Refinery product | August 2026 | August 2025 | Change |
|---|---|---|---|
| Petrol (motor spirit) | 357.3 million litres | 254.0 million litres | +40.65% |
| High speed diesel | 631.1 million litres | 479.7 million litres | +31.57% |
| Furnace oil | 275.8 million litres | 162.5 million litres | +69.75% |
| Jet fuel | 85.4 million litres | 58.9 million litres | +44.92% |
| LPG | 88.9 million litres | 70.7 million litres | +25.75% |
Petroleum products alone added 1.17 points to the 1.85 per cent growth for July and August, PBS says. More local refining does not cut the pump price by itself, because OGRA prices refinery petrol at the cost of importing it. How that cost becomes a price is set out in the petrol price formula.
Cars, motorcycles and garments grew by double digits
Vehicles and clothes also grew strongly. Car output rose 6.02 per cent to 13,146 and jeeps rose 13.07 per cent to 5,978. Motorcycles rose 27.2 per cent to 218,758. Garments rose 10.85 per cent to 7.25 million dozen. Trucks rose 62.48 per cent from a small base.
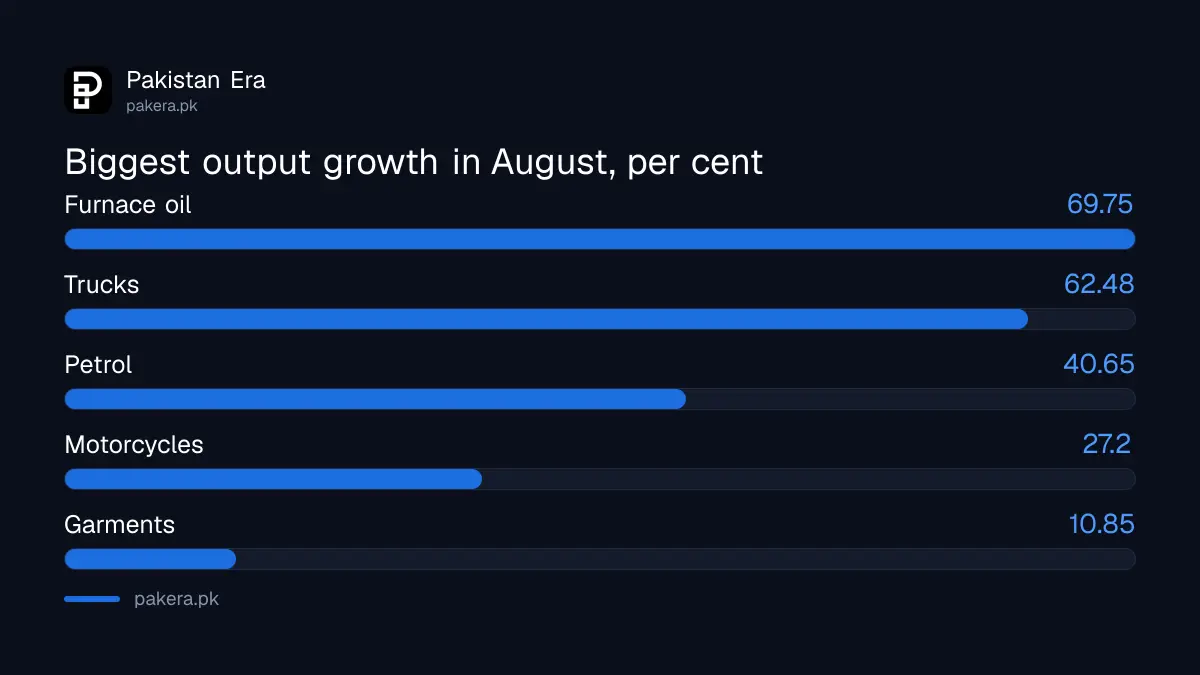
For July and August together, cars and jeeps are up 30.46 per cent and motorcycles 37.41 per cent. Garments added 2.85 points to the two month growth, the biggest single push. Cars added 1.20 points.
Home appliances were mixed. Air conditioners rose 19.22 per cent and fridges 8.63 per cent, but electric fans fell 12.67 per cent. Tractors rose 11.36 per cent to 1,265 in August, though they are down 4.52 per cent over the two months.
Food, cooking oil and medicines shrank
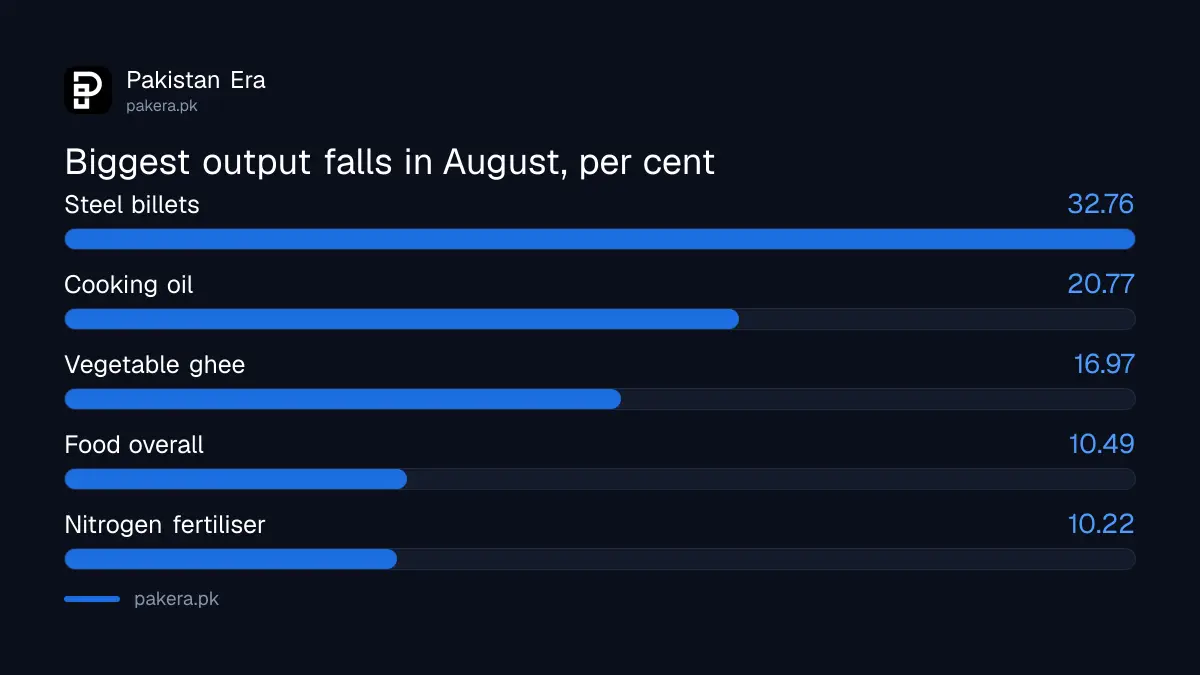
Food production fell 10.49 per cent in August, PBS says, and took 1.20 points off the two month total. Cooking oil fell 20.77 per cent and vegetable ghee 16.97 per cent. Medicines fell 8.86 per cent, with injections down 44.7 per cent.
| Product | August 2026 | August 2025 | Change |
|---|---|---|---|
| Cooking oil | 47,453 tonnes | 59,891 tonnes | -20.77% |
| Vegetable ghee | 100,549 tonnes | 121,104 tonnes | -16.97% |
| Soft drinks and mineral water | 234.2 million litres | 262.1 million litres | -10.63% |
| Nitrogen fertiliser | 279,545 tonnes | 311,376 tonnes | -10.22% |
| Steel billets | 195,000 tonnes | 290,000 tonnes | -32.76% |
| Cement | 3.29 million tonnes | 3.41 million tonnes | -3.52% |
A smaller factory output of ghee and oil does not mean shortages on its own, because PBS counts production, not stock or imports. Still, it is worth watching against the shop prices in the PBS weekly ghee and cooking oil prices. Chemicals took 0.89 points off the two month growth, and medicines 0.86.
Textiles, the biggest sector, are still falling
Textiles carry 18.16 per cent of the LSM index, more than any other group, and they fell 2.80 per cent in August. Yarn rose 1.46 per cent and cloth was flat at 0.04 per cent, but jute goods and blankets fell sharply. Textiles took 0.52 points off the two month total.
That split matters. Garments, which are made from cloth, are growing fast, while the spinning and weaving base is flat. Footballs fell 37.97 per cent. PBS reports the numbers without reasons, and we have not added any.
To read the PBS release yourself, follow these steps.
- Open the PBS website and find "Quantum Index Numbers of Large Scale Manufacturing" for August 2026.
- Read the summary for the overall index and the growth rates.
- Download Table 1 for the 123 products, with August, July and a year earlier.
- Use the last two columns for the change on August 2025 and for July to August.
Monthly factory data feeds into the wider picture of the economy, such as GDP growth and per capita income. The September 2026 LSM figures are due from PBS in about a month.
Common questions about LSM in August 2026
What was LSM growth in August 2026?
Output rose 0.67 per cent against August 2025 and fell 4.96 per cent against July 2026, according to PBS.
What is the LSM growth for July to August 2026?
1.85 per cent against July to August 2025. The index for the two months is 116.14.
Which industries grew the most?
Petroleum products, up 31.85 per cent, along with cars, motorcycles, garments and trucks. Garments and cars added the most to growth over two months.
Which industries fell?
Food, down 10.49 per cent, plus chemicals, medicines, iron and steel, fertiliser and cement.
What is the LSM base year?
2015-16, set at 100. The overall index has a weight of 78.37 across all the items PBS tracks.
How we verified this
What we checked, where we read it, and what we could not confirm.
Last checked 20 October 2026. We read the PBS summary of provisional LSM indices for August 2026, the Word summary attached to it, and Table 1 of product output, all on 20 October 2026. Every figure on this page comes from those three files, except the conversions into millions, which are our rounding. PBS gives no reasons for the changes, so we have not suggested any. All figures are provisional and can be revised next month.
About the author

Global Affairs & Political Economy Writer
Muhammad Hatim is a book lover who started writing because he enjoys it. At Pakistan Era he writes about international relations, geopolitics and the global economy, with a particular interest in South Asia and the forces behind current events.