Islamabad AQI Today: Check Pak-EPA's Official Reading, Plus Every November 2025 Day
Check Islamabad's official AQI on Pak-EPA's site in four steps. Last November had no Good day: 25 Unhealthy, 3 Very Unhealthy. See the bands and what to do.
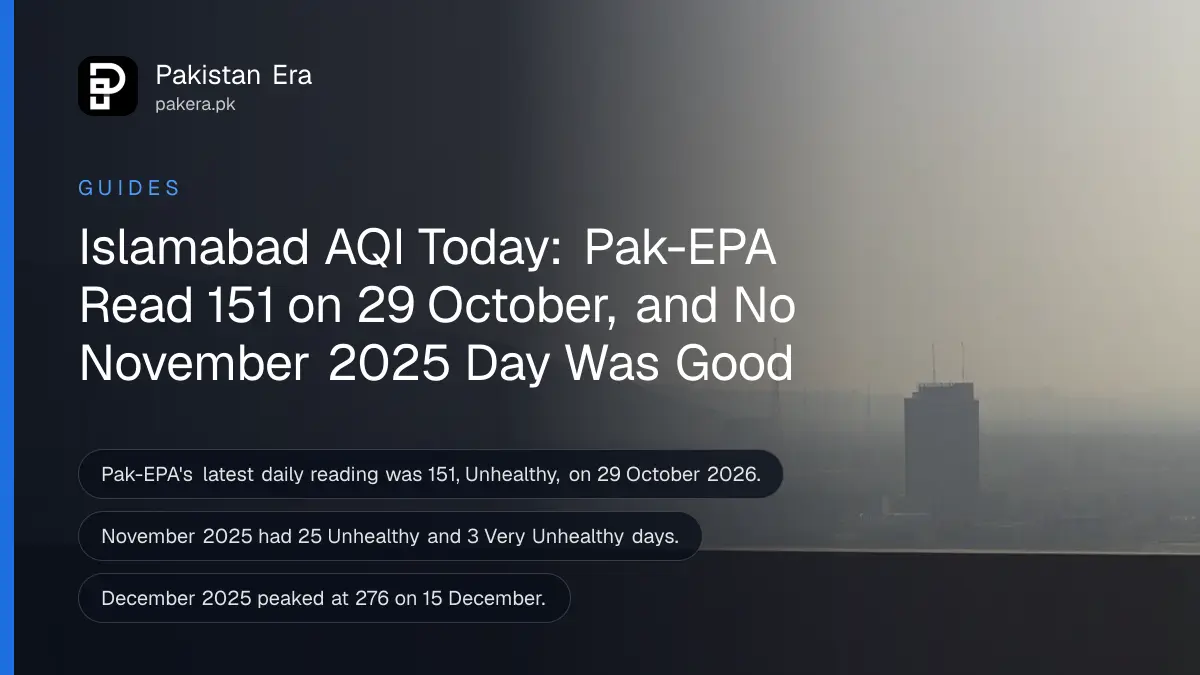
Islamabad's official air quality index comes from the Pakistan Environmental Protection Agency (Pak-EPA), which posts a daily table on environment.gov.pk under "Air Quality Index of Islamabad" and a full report each month. Its latest daily reading, for 29 October 2026, was 151, Unhealthy. If last year is a guide, November will be worse: Pak-EPA's own tables show not one Good or Moderate day in Islamabad in November 2025.
Below is how to find the reading yourself, what each band means for your family, every November 2025 figure we pulled from Pak-EPA's report, and what to do when the daily table does not appear. We opened the reports on 1 November 2026.
Pak-EPA posts Islamabad's daily AQI on its website
Open environment.gov.pk and look under Latest News for "Air Quality Index of Islamabad". The item shows a table for the previous day, with PM2.5, sulphur dioxide, carbon monoxide and nitrogen dioxide, each with its AQI and band.
The table splits the day into three eight hour blocks and then gives a 24 hour average. PM2.5 is fine dust small enough to reach deep into the lungs, and in Islamabad it is almost always the pollutant that sets the AQI. Pak-EPA adds a warning under its tables: data from any other source about Islamabad's air is not verified or approved by the agency.
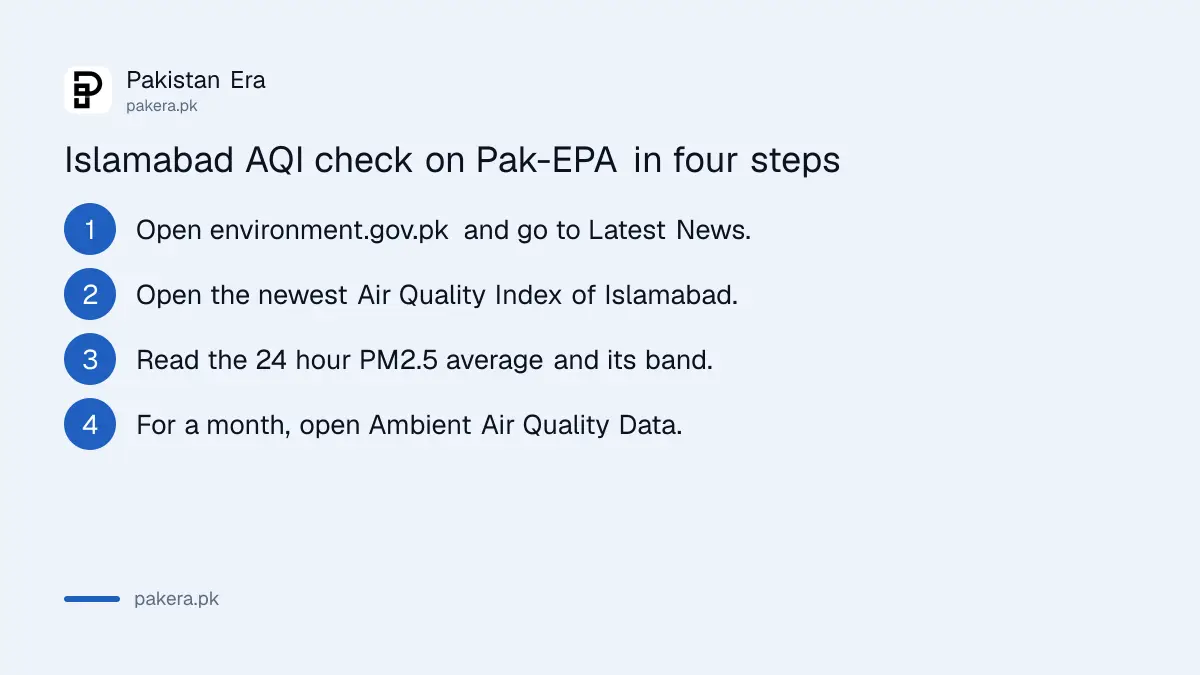
- Go to environment.gov.pk and scroll to Latest News.
- Open the newest "Air Quality Index of Islamabad" item and check its date.
- Read the 24 hour PM2.5 average and the AQI band next to it.
- For a whole month, open Facilities / Services, then CLEAN Laboratory, then Ambient Air Quality Data.
The daily item is posted a day late, and not every day. When we checked on 1 November, the latest table was for 29 October, which we reported as Islamabad AQI 151 on 29 October.
What each AQI band means for your family
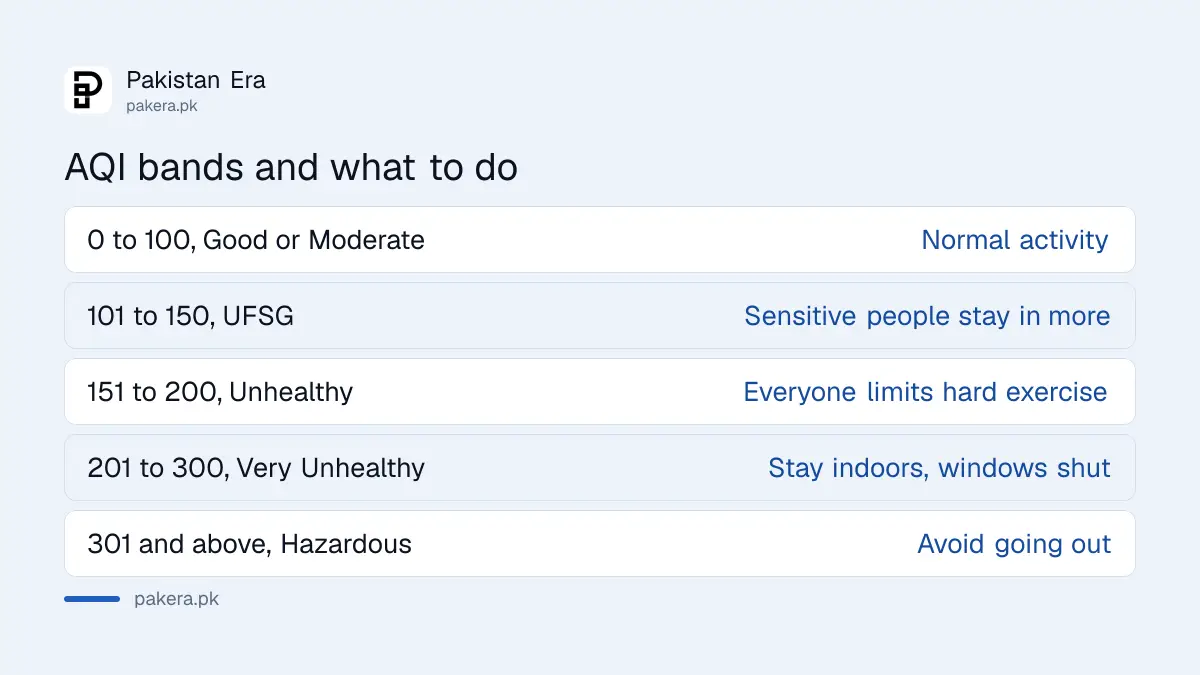
Pak-EPA's tables name six bands, from Good to Hazardous. Above 100, children, older people and anyone with asthma or heart disease should cut time outdoors. Above 150, everyone should limit hard outdoor exercise, and above 200 it is better to stay in.
| AQI | Band | What to do |
|---|---|---|
| 0 to 50 | Good | Normal outdoor activity |
| 51 to 100 | Moderate | Very sensitive people take care |
| 101 to 150 | Unhealthy for sensitive groups (UFSG) | Children, elderly and asthma patients cut outdoor time |
| 151 to 200 | Unhealthy | Everyone limits long or hard outdoor activity |
| 201 to 300 | Very Unhealthy | Stay indoors where you can, keep windows shut |
| 301 and above | Hazardous | Avoid going out |
These are the ranges of the standard AQI scale, and the advice column is general health guidance tied to that scale, not a Pak-EPA order. One quirk: in Pak-EPA's 2025 tables a reading of exactly 150 was labelled Unhealthy and exactly 200 was labelled Very Unhealthy, one band higher than the usual scale. So read the band word Pak-EPA prints, not only the number. For practical steps at home, the advice on how to protect children and elderly people from smog applies in Islamabad too.
Every November 2025 day in Islamabad was Unhealthy or worse
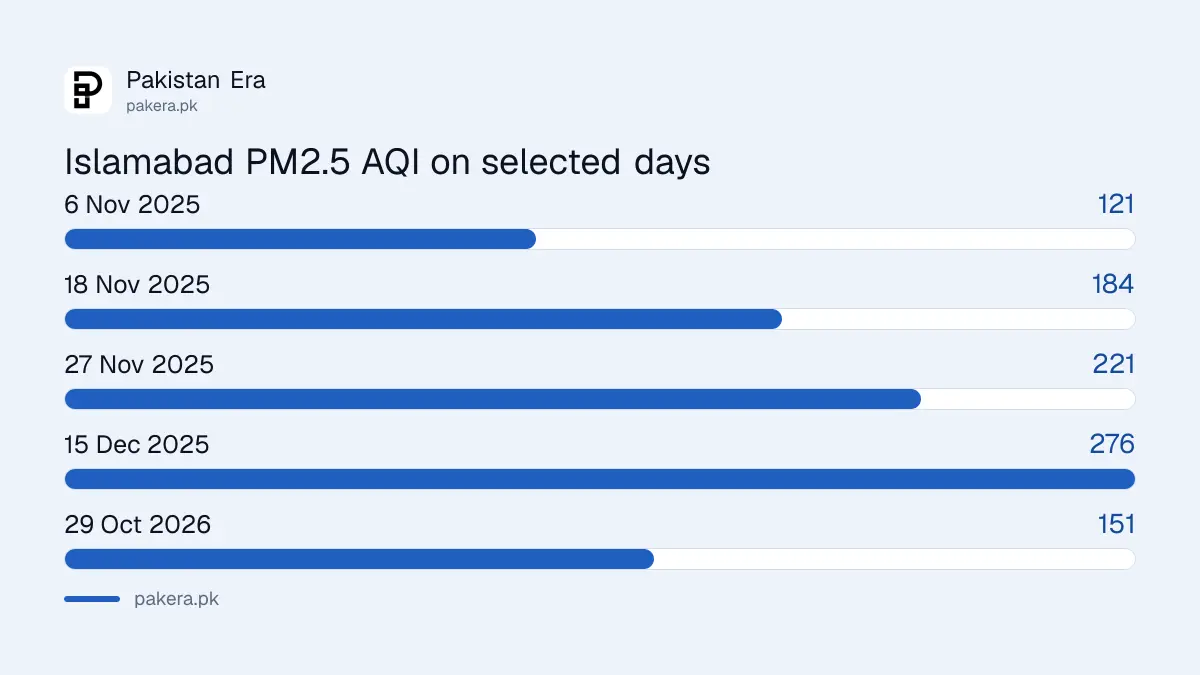
Pak-EPA's November 2025 report gives 30 daily PM2.5 readings. Two days were UFSG, 25 were Unhealthy and three were Very Unhealthy. The best day was 121 on 6 November. The worst were 221 on 27 and 28 November.
| Islamabad, PM2.5 AQI | November 2025 | December 2025 |
|---|---|---|
| Days with data | 30 | 30 (no reading on 2 December) |
| UFSG days | 2 | 1 |
| Unhealthy days | 25 | 12 |
| Very Unhealthy days | 3 | 17 |
| Best day | 121, 6 November | 117 |
| Worst day | 221, 27 and 28 November | 276, 15 December |
| Monthly average in the report | 192 | 199 |
By our arithmetic, the plain average of the 30 daily November readings is 172.7, and for December it is 205.8. Pak-EPA's own average rows read 192 and 199, which suggests the agency averages the dust readings first and then converts. The gases stayed in the Good band almost every day. Dust did all the damage.
This year started cleaner, but the trend points up
September 2026 averaged an AQI of 116 in Pak-EPA's monthly report, and 29 October reached 151. That puts late October 2026 roughly where Islamabad was in early November 2025, a few days ahead of the worst months.
The National Disaster Management Authority's seasonal outlook expects more rain than usual over Islamabad and the north in November, which would wash dust out of the air for a day or two after each spell. It expects drier weather in December, when smog usually peaks. Our honest read: a wetter November could mean fewer bad days than last year, but December is likely to be poor again. The PMD forecast for 31 October to 5 November shows dry weather in the plains for now.
When the daily table does not appear
Pak-EPA does not post every day. On 1 November there were no tables for 30 or 31 October. When that happens, use the most recent day and the monthly report, and do not treat an app's number as the official reading.
Private apps and sensor maps often show a different number for Islamabad. Some use other formulas or sensors in one spot. They can still warn you that a bad day is coming, but Pak-EPA says only its own data is verified for Islamabad. For questions, the agency's listed number is 051-9250715. The monthly September figures are in the report on Islamabad air quality in September 2026.
Common questions
Where can I check Islamabad AQI today?
On environment.gov.pk, under Latest News, in the item called "Air Quality Index of Islamabad". It shows the previous day.
What was Islamabad's AQI on 29 October 2026?
151, Unhealthy, with a 24 hour PM2.5 average of 56.7 micrograms per cubic metre against a limit of 35.
How bad was Islamabad's air in November 2025?
No day was Good or Moderate. Pak-EPA recorded 2 UFSG days, 25 Unhealthy days and 3 Very Unhealthy days.
Which month is worst for smog in Islamabad?
December in Pak-EPA's 2025 data, with 17 Very Unhealthy days and a peak of 276 on 15 December.
Why does my app show a different AQI?
Apps use other sensors and formulas. Pak-EPA says only its own data for Islamabad is verified.
What is the safe limit for PM2.5 in Pakistan?
The national standard Pak-EPA uses is 35 micrograms per cubic metre as a 24 hour average.
How we verified this
What we checked, where we read it, and what we could not confirm.
Last checked 1 November 2026. We read Pak-EPA's November 2025 and December 2025 monthly AQI reports and its list of 2026 reports on the Pak-EPA website on 1 November 2026, along with its daily table for 29 October 2026. The counts, the plain averages and the comparison are our own arithmetic from those reports. The November outlook is from the NDMA's October to December 2026 early warning report. The band ranges are the standard AQI scale; Pak-EPA's site does not publish its own range table, so we could not confirm its exact cut-offs.
About the author

Senior Writer, Public Services and Technology
Shahid joined us in 2024 as an author. He is a senior contributor to Pakistan's leading technology websites. He writes detailed articles, mostly covering his expertise in the latest tech, mobiles, apps, gadgets, and step-by-step guides. His ideology is to help people understand the latest trends and explain complex methods through very easy-to-understand guides.