Pakistan Inflation Rate 2026: Every Month's CPI From PBS, January to September (Full List)
Pakistan's CPI inflation by month in 2026 from PBS: 5.8% in January, a peak of 11.7% in May and 10.3% in September. See urban, rural and core rates too.
Pakistan's inflation rate in 2026 started at 5.8% in January, climbed to a high of 11.7% in May, and stood at 10.3% in September, the latest month the Pakistan Bureau of Statistics (PBS) has published. October's figure is due from PBS in the first days of November. Below is every month of 2026 so far, with urban, rural and core rates, taken from the PBS monthly review.
Update, 2 November 2026: PBS has now published October, and Pakistan's inflation fell to 9.6% in October 2026, with prices up 1.1% in the month.
We downloaded the PBS Monthly Review for September 2026 on 1 November 2026 and read its Table 1.a, which lists consumer price index (CPI) inflation for each month back to December 2024. CPI inflation is the yearly rise in the prices of a fixed basket of goods and services that a typical household buys.
Pakistan's CPI inflation was 10.3% in September 2026
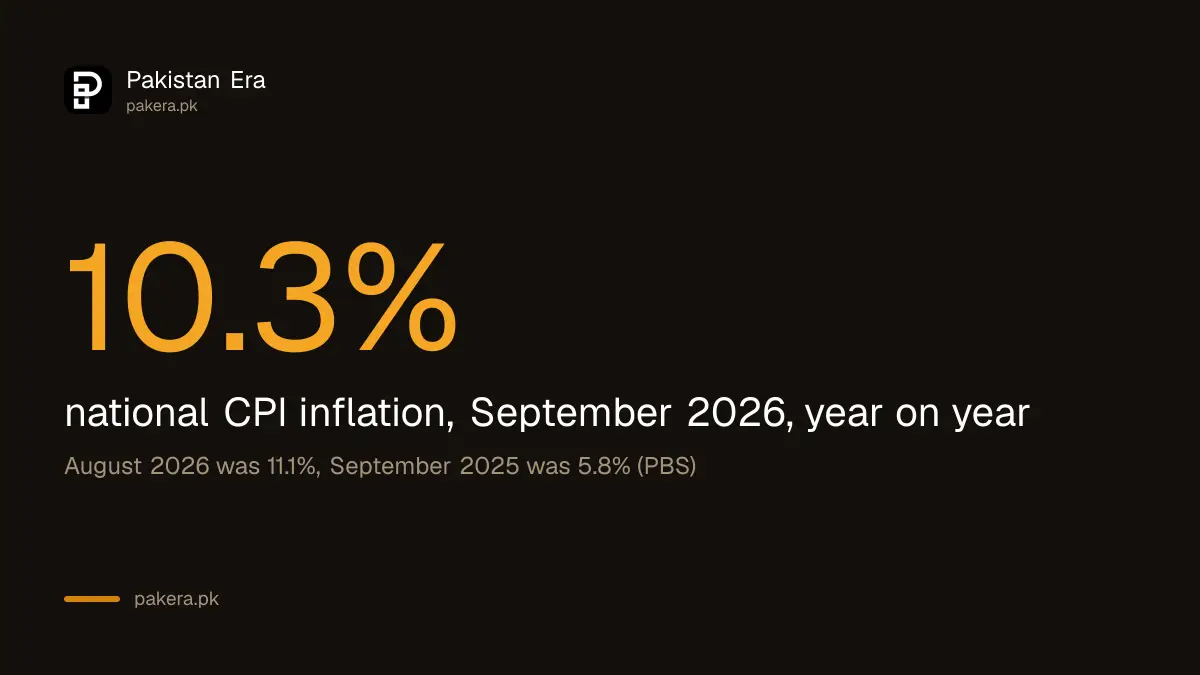
National CPI inflation was 10.3% in September 2026, down from 11.1% in August. Prices rose 1.3% in the single month from August to September. In September 2025 the yearly rate had been just 5.8%, so inflation has nearly doubled in a year.
The month-on-month figure matters for your budget. A 1.3% rise in one month means a basket that cost Rs 10,000 in August cost about Rs 10,130 in September. Electricity and onions drove much of the inflation in September 2026.
Every month of 2026: the full CPI list
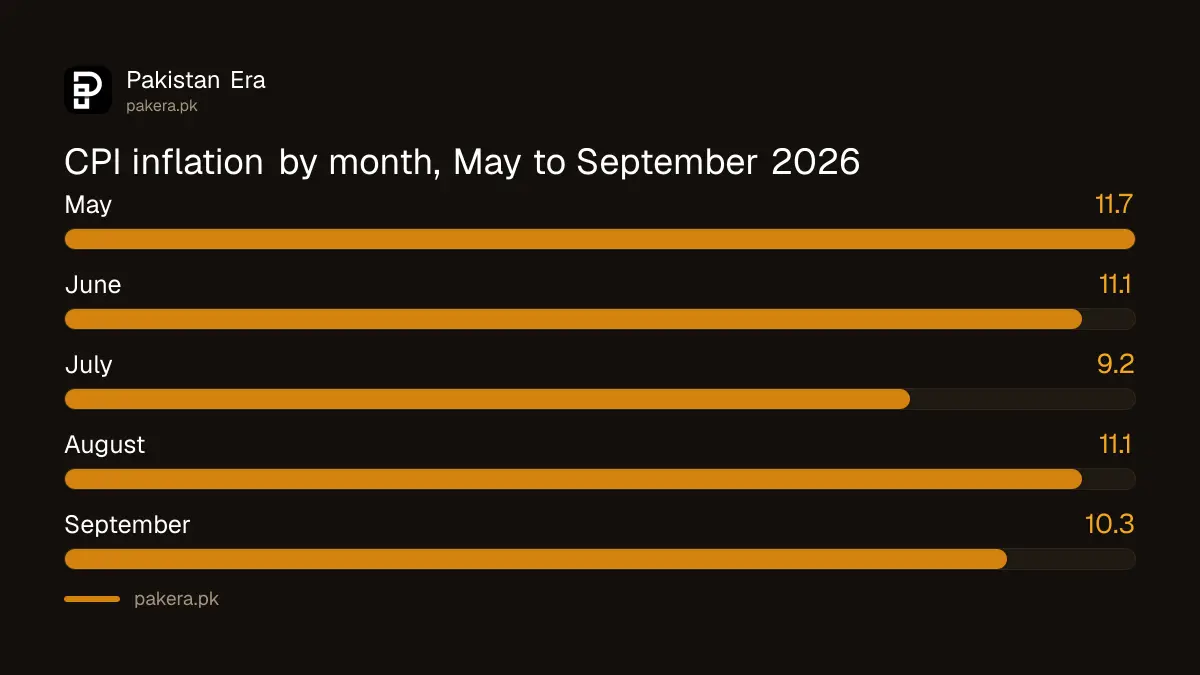
The table gives national CPI inflation for each month of 2026, year on year, plus the monthly change and the urban and rural rates. All figures are from PBS Table 1.a. The last column shows the same month in 2025 for comparison.
| Month | National CPI (YoY) | Change in the month | Urban | Rural | Same month 2025 |
|---|---|---|---|---|---|
| January 2026 | 5.8% | 0.4% | 5.8% | 5.8% | 2.4% |
| February 2026 | 7.0% | 0.3% | 6.8% | 7.3% | 1.5% |
| March 2026 | 7.3% | 1.2% | 7.4% | 7.2% | 0.7% |
| April 2026 | 10.9% | 2.5% | 11.1% | 10.6% | 0.3% |
| May 2026 | 11.7% | 0.5% | 11.8% | 11.5% | 3.5% |
| June 2026 | 11.1% | -0.3% | 11.2% | 10.9% | 3.2% |
| July 2026 | 9.2% | 1.2% | 8.7% | 9.9% | 4.1% |
| August 2026 | 11.1% | 1.2% | 10.4% | 12.2% | 3.1% |
| September 2026 | 10.3% | 1.3% | 10.1% | 10.5% | 5.8% |
| October 2026 | Due early November | - | - | - | 6.2% |
The simple average of the nine monthly rates is about 9.4%. That is our arithmetic, not a PBS figure. PBS gives its own average for July to September 2026: 10.20%, against 4.30% in the same three months of 2025.
The big jump came in April 2026, when inflation went from 7.3% to 10.9%
April 2026 was the turning point. Prices rose 2.5% in that one month, the largest monthly rise of the year so far, and the yearly rate jumped 3.6 points to 10.9%. Inflation has stayed between 9.2% and 11.7% every month since.
The PBS table shows where it came from. Urban non-food inflation went from 10.3% in March to 13.8% in April. Non-food covers rent, electricity, gas, fuel, transport and services. Food was less of a driver in April: urban food inflation was 6.9%.
Low numbers in 2025 also play a part. When prices barely moved a year earlier, as in April 2025 at 0.3%, any rise now shows up as a big yearly rate. Economists call this the base effect.
Core inflation stayed between 7.2% and 9.0% in towns
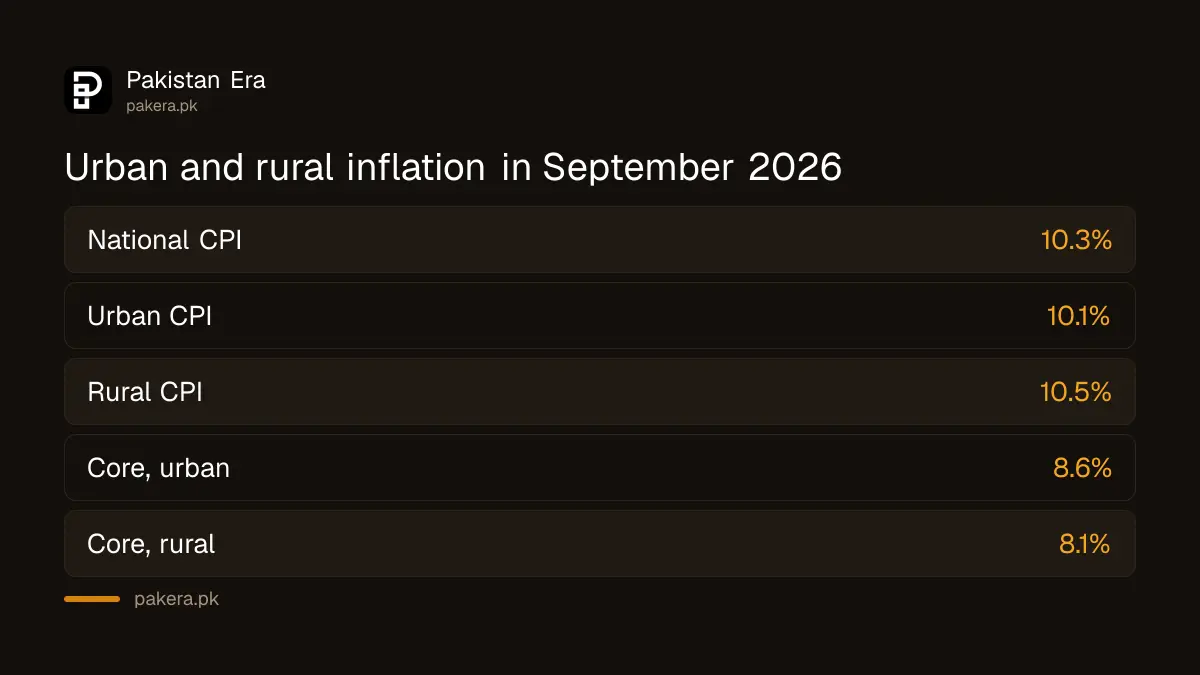
Core inflation strips out food and energy, whose prices jump around. PBS measures it as non-food non-energy (NFNE) inflation. In towns it moved from 7.2% in January to a high of 9.0% in May and was 8.6% in September. In villages it was 8.1% in September.
Core inflation is what the State Bank watches when it sets interest rates, because it shows whether price rises are spreading across the economy. The difference between CPI, SPI, WPI and core is explained in CPI, SPI, WPI and core inflation in Pakistan.
| Month | Core, urban | Core, rural | Wholesale (WPI) |
|---|---|---|---|
| January 2026 | 7.2% | 8.3% | 0.2% |
| March 2026 | 7.4% | 8.4% | 6.7% |
| May 2026 | 9.0% | 8.4% | 12.7% |
| July 2026 | 8.6% | 8.1% | 9.4% |
| September 2026 | 8.6% | 8.1% | 13.3% |
Wholesale prices rose far faster than shop prices over the year. WPI inflation was 13.3% in September 2026. When wholesale costs rise, shops often pass part of it on later.
October 2026 inflation is forecast at 9.5% to 10.5%
The Finance Division's Monthly Economic Update for October 2026 projects headline inflation of 9.5% to 10.5% for October. The ministry says the path after that depends on world energy prices, food supplies and base effects. October 2025 inflation was 6.2%, which gives a higher base than September's.
The State Bank raised its policy rate by 0.5 points to 12% from 27 October 2026, citing inflation risks from energy prices. That decision is covered in the SBP policy rate rise to 12%, and the forecast in full in the Finance Division's October inflation forecast.
How to check the new inflation figure yourself on the PBS site
PBS posts the monthly CPI release on its website, usually in the first days of the month. The September figure came on 1 October 2026. You do not need any account to read it.
- Open the Pakistan Bureau of Statistics website.
- Look under "What's New" for "Monthly Inflation Report" with the month's name.
- Open the review file attached to the post.
- Find Table 1.a for national, urban and rural rates, year on year and month on month.
- Use Table 1 for item-level changes such as electricity, wheat and onions.
To turn the national rate into your own number, the method in calculating your own inflation rate uses the PBS weights for each spending group.
Common questions
What is the inflation rate in Pakistan right now?
The latest official rate is 10.3% for September 2026, from PBS. The October 2026 rate will replace it when PBS publishes in early November.
Which month had the highest inflation in 2026?
May 2026, at 11.7% year on year. June and August both came in at 11.1%.
Which month had the lowest inflation in 2026?
January 2026, at 5.8%. Inflation then rose almost every month until May.
Is inflation higher in cities or villages?
In September 2026 it was 10.1% in urban areas and 10.5% in rural areas. Rural inflation was higher in July and August too, at 9.9% and 12.2%.
When will PBS publish October 2026 inflation?
PBS usually publishes in the first few days of the month. September's came on 1 October, so October's is expected in the first days of November 2026. PBS has not announced a date.
Does my savings profit beat inflation?
Only if your after-tax rate is above about 10%. A 10% bank savings rate, after 15% tax for filers, gives 8.5%, which is below September's 10.3%.
How we verified this
What we checked, where we read it, and what we could not confirm.
Last checked 1 November 2026. Monthly CPI, urban, rural, core and WPI rates come from Table 1.a and Table 1.b of the PBS Monthly Review for September 2026, which we downloaded from pbs.gov.pk on 1 November 2026; the July to September averages come from its Table 1.1. The October forecast comes from the Finance Division's Monthly Economic Update and Outlook for October 2026, which we read the same day. The nine-month average and the Rs 10,000 example are our own arithmetic. PBS had not posted the October 2026 figure when we checked, and it gives no fixed release date.
About the author

Global Affairs & Political Economy Writer
Muhammad Hatim is a book lover who started writing because he enjoys it. At Pakistan Era he writes about international relations, geopolitics and the global economy, with a particular interest in South Asia and the forces behind current events.