How to Calculate Your Own Inflation Rate in Pakistan From PBS Data
Work out your own inflation rate in Pakistan with PBS item data. A sample household on Rs 100,000 a month got 10.67%, against the official urban 10.12%.
Short answer: To find your own inflation rate, list what you spend each month, look up each item's one year price change in the PBS Monthly Review, and divide this year's spending by one plus that change. We did this for a sample urban household spending Rs 100,000 a month. Its personal inflation came to 10.67 per cent, against the official urban rate of 10.12 per cent.
The official figure is an average for all households. Your bills are not average. A family that pays rent, drives a motorbike and cooks on LPG feels something different from a family that owns its home and walks to work.
We opened the Pakistan Bureau of Statistics (PBS) Monthly Review on Price Indices for September 2026 on 12 October 2026. We read the urban commodity list in Annexure A, which gives the change in 94 items over one year. The method below works with any list of items.
The official urban rate was 10.12 per cent in September 2026
PBS says the urban consumer price index rose 10.12 per cent in September 2026 from September 2025. The national figure was 10.26 per cent and the rural one 10.47 per cent. Each is a weighted average of many items that households buy.
The weights come from a household survey. In the urban index, house rent carries 19.26 per cent of the weight, milk 7.11 per cent, wheat flour 3.01 per cent, electricity 4.56 per cent and motor fuel 2.91 per cent. Your own weights depend on what you spend.
For the full picture on the headline numbers, see our explainer on inflation at 10.3 per cent in September and the guide to the four inflation numbers.
The method takes six steps and a calculator
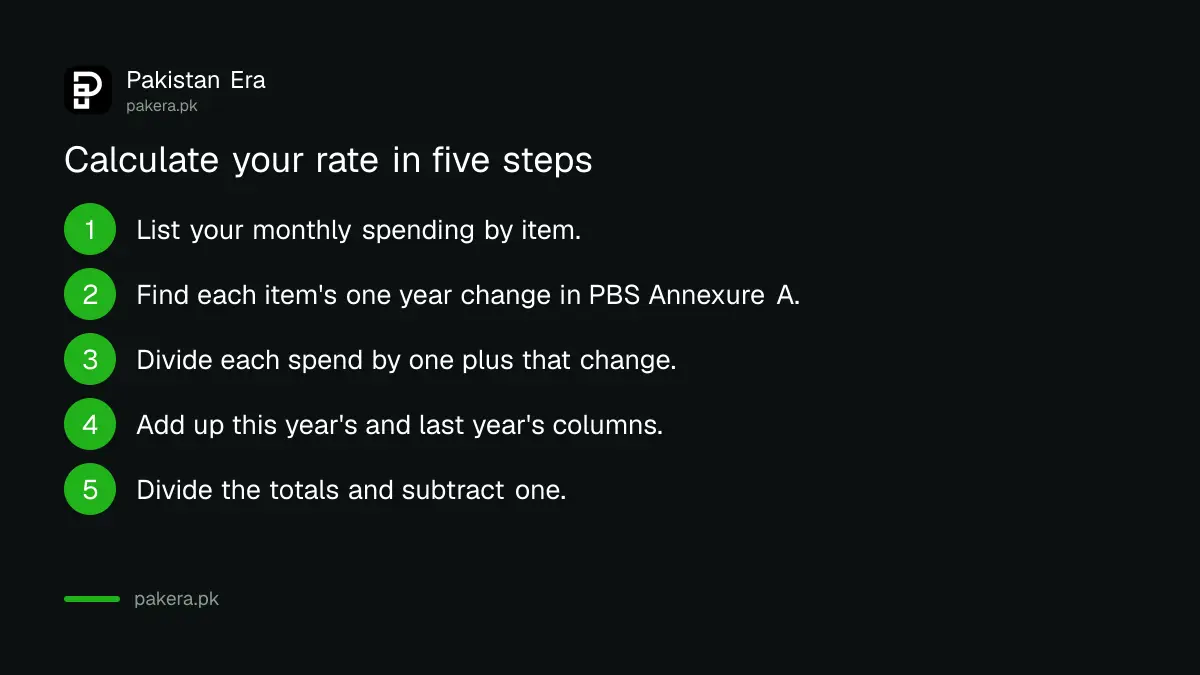
You need one list and one column of percentages. Write down your monthly spending by item. Find each item's change in the PBS annexure. Divide each amount by one plus the change to get last year's cost for the same item. Add both columns and compare the totals.
- Open the PBS Monthly Review for September 2026 and go to Annexure A for urban households or Annexure B for rural ones.
- List your monthly spending by line, such as rent, electricity, flour and fuel.
- Find each line's change in the last column, "September 2025", which is the one year change.
- For each line, divide this year's spending by one plus the change. A 10 per cent rise means dividing by 1.10.
- Add up the two columns: this year's spending and last year's equivalent.
- Divide this year's total by last year's total and subtract one. That is your personal rate.
A sample household spending Rs 100,000 a month
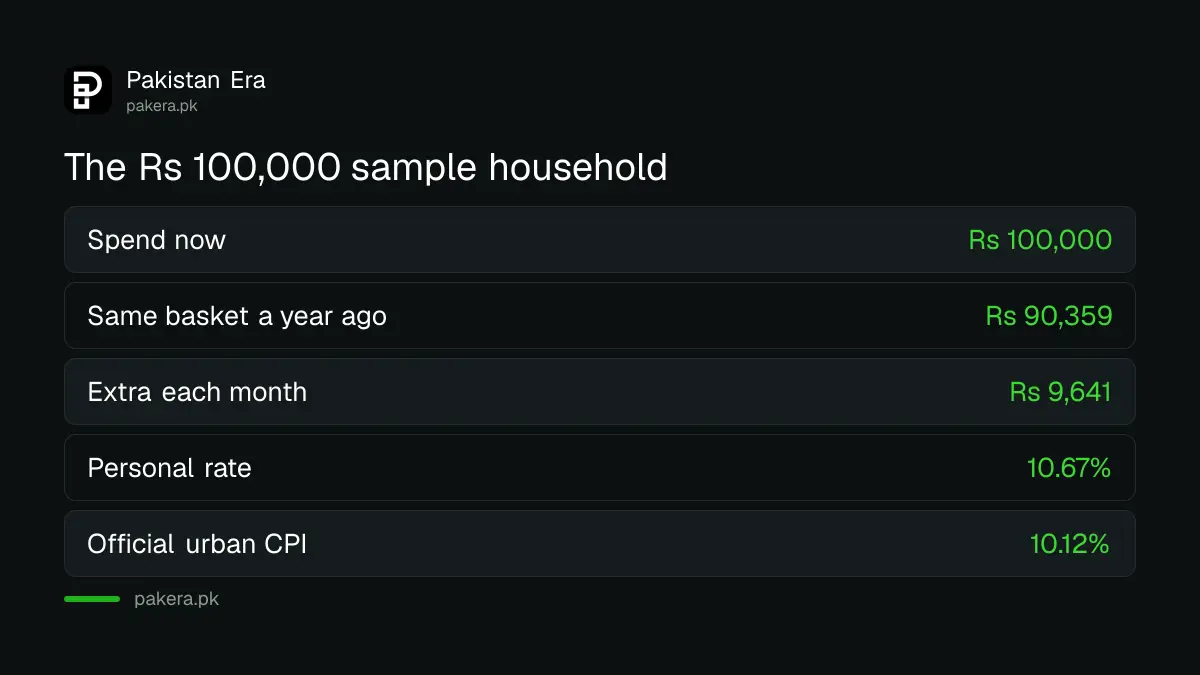
We built a sample urban household with 25 spending lines that add to Rs 100,000. We used the PBS urban changes for September 2026 against September 2025. The same basket cost Rs 90,359 a year earlier, so the household needs Rs 9,641 more each month.
| Item (PBS name) | Spend now (Rs) | PBS one year change | Same item a year ago (Rs) |
|---|---|---|---|
| House rent | 25,000 | Up 6.12% | 23,558 |
| Electricity charges | 8,000 | Up 32.46% | 6,040 |
| Motor fuel | 8,000 | Up 37.73% | 5,808 |
| Milk fresh | 7,000 | Up 8.16% | 6,472 |
| Education | 6,000 | Up 7.35% | 5,589 |
| Wheat flour | 4,000 | Up 31.71% | 3,037 |
| Transport services | 4,000 | Up 29.56% | 3,087 |
| Chicken | 3,000 | Down 20.92% | 3,794 |
| Fresh vegetables | 3,000 | Up 5.51% | 2,843 |
| Readymade food | 3,000 | Up 7.56% | 2,789 |
| Fresh fruits | 3,000 | Up 14.75% | 2,614 |
| Readymade garments | 3,000 | Up 5.16% | 2,853 |
| Cooking oil | 2,500 | Up 7.85% | 2,318 |
| Communication services | 2,500 | Up 19.30% | 2,096 |
| Drugs and medicines | 2,000 | Up 7.94% | 1,853 |
| Rice | 2,000 | Up 2.92% | 1,943 |
| Meat | 2,000 | Up 14.68% | 1,744 |
| Washing soap and detergents | 2,000 | Up 8.39% | 1,845 |
| Sugar | 1,500 | Down 19.94% | 1,874 |
| Liquefied hydrocarbons (LPG) | 1,500 | Up 57.14% | 955 |
| Gas charges | 1,500 | No change | 1,500 |
| Tea | 1,500 | Up 4.83% | 1,431 |
| Pulse gram | 1,500 | Down 13.49% | 1,734 |
| Tailoring | 1,500 | Up 12.81% | 1,330 |
| Eggs | 1,000 | Down 20.19% | 1,253 |
| Total | 100,000 | Up 10.67% | 90,359 |
Energy drove the result, and food pulled it down
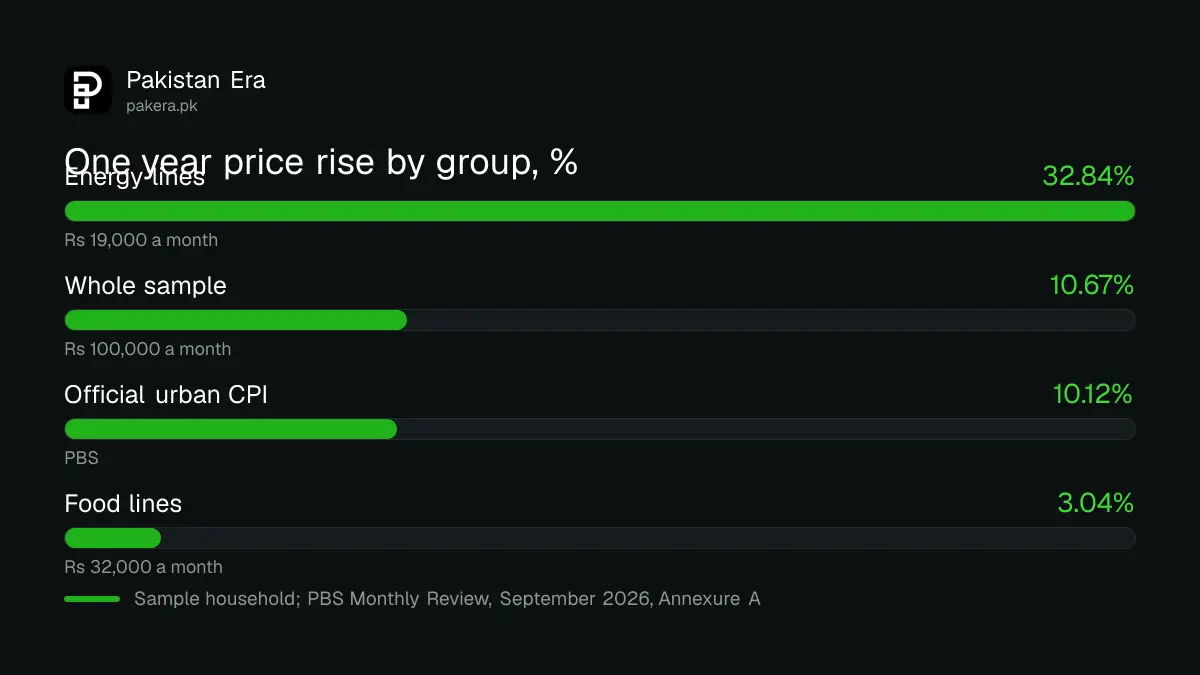
In the sample, the four energy lines, electricity, motor fuel, LPG and gas, add up to Rs 19,000 a month and rose 32.84 per cent. The twelve food lines add up to Rs 32,000 and rose only 3.04 per cent, because chicken, sugar, eggs and pulse gram fell.
Energy is 19 per cent of the spending but accounts for Rs 4,697 of the Rs 9,641 extra cost. So close to half of this family's rise comes from fuel, power and cooking gas. That share is the part most households can plan around, for example by checking the savings rate against inflation and the fuel they use.
| Sample group | Spend now (Rs) | Change |
|---|---|---|
| Energy: electricity, motor fuel, LPG, gas | 19,000 | Up 32.84% |
| Food and drink lines in the sample | 32,000 | Up 3.04% |
| Whole sample | 100,000 | Up 10.67% |
| Official urban CPI, September 2026 | Not applicable | Up 10.12% |
Your rate changes as soon as your list changes
If the sample household sold its motorbike and spent the Rs 8,000 of fuel money on bus and van fares, its rate would be 10.22 per cent. If it owned its home and paid no rent, the rate on the remaining Rs 75,000 would be 12.27 per cent.
That second number surprises people. Rent rose only 6.12 per cent, which is below the average. A family without rent has less of that slow item in its basket, so faster items such as power and flour weigh more. This is why a national average cannot describe every household.
Keep three limits in mind. First, the PBS list covers 94 item groups, not every product. Second, the PBS changes are national urban averages, and your city may differ. Third, this method looks back one year, so it says nothing about next month.
What to do with your number
Use your personal rate in three places. Compare it with your pay rise. Compare it with the profit rate on your savings. And use it to test any "inflation proof" claim, since your basket may not look like the official one.
For a quick check of what prices have done to a lump sum, our guide to calculating the value of a rupee since 2022 uses the same PBS series for a different question. And where each number comes from is set out in our guide to checking Pakistan's economy numbers on the official pages.
Common questions
How do I calculate my personal inflation rate in Pakistan?
Divide each monthly spending line by one plus its PBS one year change, add up both columns, then divide this year's total by last year's total and subtract one. The result is your rate.
Where do I find the PBS item changes?
They are in the Monthly Review on Price Indices on the PBS website. Annexure A covers urban households, Annexure B rural ones and Annexure C wholesale prices.
Why is my rate different from the official one?
Your spending weights differ from the survey average. Renting, driving, using LPG or buying school fees changes the mix, and the items move at very different speeds.
Should I use urban or rural figures?
Use the one that matches where you live and shop. PBS shows both. In September 2026 the rural figure was 10.47 per cent and the urban one 10.12 per cent.
Does the PBS list cover every item I buy?
No. It covers 94 groups in the urban list. Pick the nearest group for anything missing, and say so in your own notes.
How often can I update the figure?
PBS publishes a new Monthly Review each month, so you can refresh the calculation once a month. The latest we found on 12 October 2026 was for September.
How we verified this
What we checked, where we read it, and what we could not confirm.
We read the PBS Monthly Review on Price Indices for September 2026, Table 1.a, Table 2 and Annexure A, on 12 October 2026 at pbs.gov.pk. The sample household is invented for the example. Every percentage in the table is the PBS figure. The personal rates are our arithmetic.
About the author

Global Affairs & Political Economy Writer
Muhammad Hatim is a book lover who started writing because he enjoys it. At Pakistan Era he writes about international relations, geopolitics and the global economy, with a particular interest in South Asia and the forces behind current events.