Check Crawl Stats in Search Console for Your Pakistani Website: 4 Numbers, 3 Host Checks and the Fixes
Check the Crawl Stats report in Search Console for your Pakistani website: where it hides, the 4 numbers, host status checks, response codes and Google's fixes.
To check how often Google crawls your Pakistani website, open Search Console, select Settings, then Crawl stats, and click Open report. You will see total crawl requests, download size, average response time and a host status. A green "No significant issues" means Google had no availability problems with your server in the past 90 days. The report only works on a Domain property or a root level URL prefix property, and Google says sites under about a thousand pages usually do not need it.
We read Google's Search Console Help page on the Crawl Stats report on 10 November 2026. Every label, threshold and time frame below is from that page. The examples about Pakistani hosting are our own advice, not Google's words.
Open the Crawl Stats report in 4 steps
The report is not in the left menu with Pages and Performance. It sits under Settings, which is why many site owners never find it.
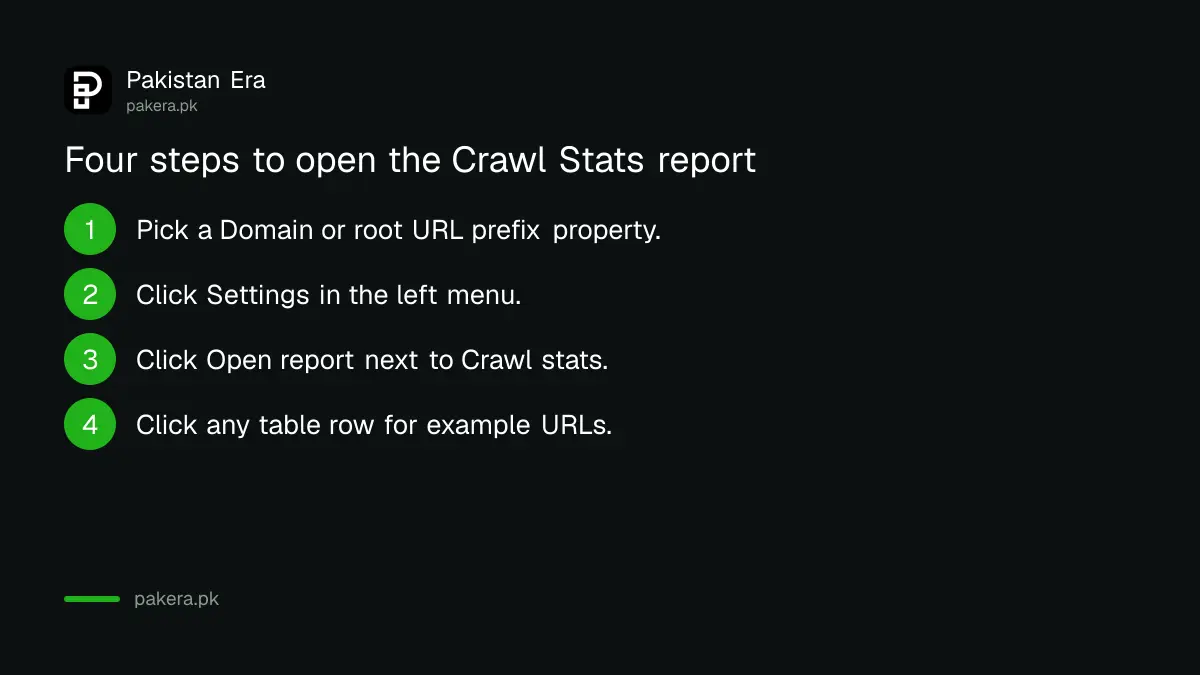
- Sign in to Search Console and pick a Domain property, or a URL prefix property for your root address such as https://example.pk/.
- In the left menu, click Settings.
- On the Settings page, find Crawl stats and click Open report.
- Read the summary chart at the top, then click any row in the tables below to see example URLs.
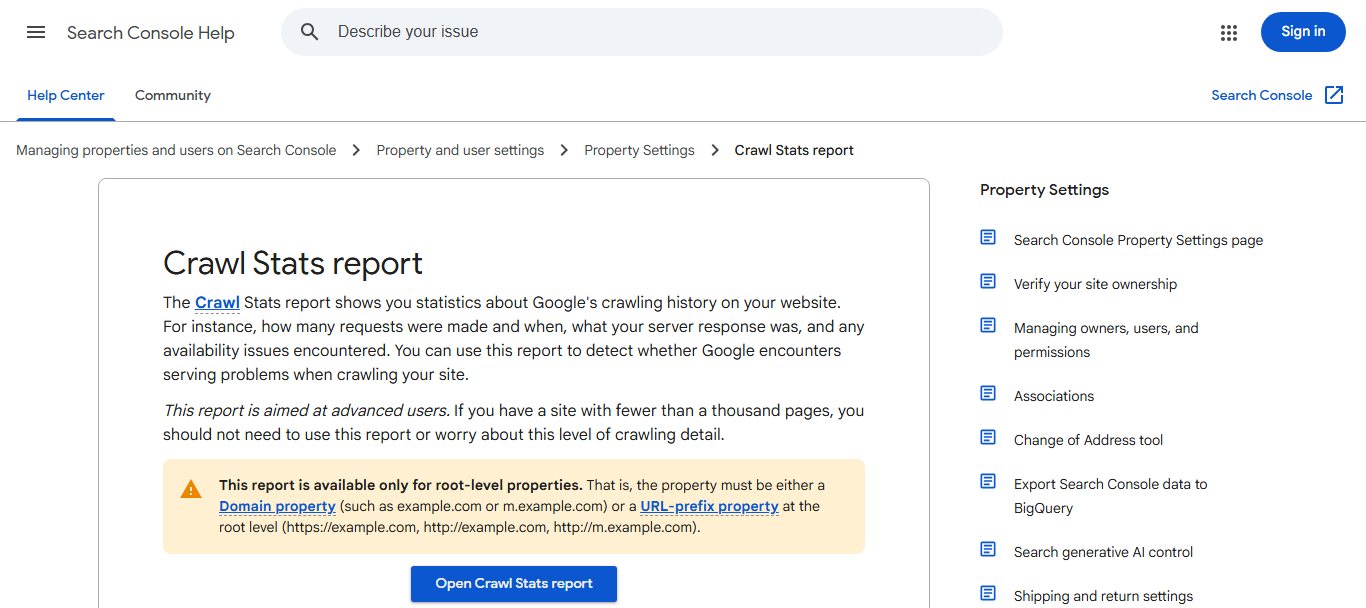
If your property is a folder, such as https://example.pk/blog/, the report will not show. Google says it is "available only for root-level properties". You can add a Domain property by DNS, as in our guide to verifying a website in Search Console.
The 4 numbers at the top and what each one means
The summary chart shows four figures for the period. Click each one to add or remove it from the chart.
| Metric | What Google counts | What to watch for |
|---|---|---|
| Total crawl requests | Every crawl request, successful or not, with duplicates counted separately | A sudden fall that lasts more than a week or two |
| Total download size | Bytes Google downloaded while crawling | A jump after adding large images or videos |
| Average response time | Average time to fetch each resource in the period | A rising line, which can mean a slow server |
| Host status | Whether Google had availability problems | Anything other than "No significant issues" |
Google says the crawl rate is normally stable over a week or two. A short dip is not a problem. A drop that holds is worth checking.
Host status: the 3 levels and the 3 checks behind them
Host status tells you if Google could reach your server. It has three levels:
- No significant issues: no significant availability problems in the past 90 days.
- Some issues, not recent: a significant issue in the last 90 days, but more than a week ago.
- Recent issue: a significant issue in the last week. Fix this first.
Click the host status to see three checks: robots.txt fetching, DNS resolution and server connectivity. Each chart has a dotted red line. Google says a failure rate above that line counts as an issue. Its example is DNS failing for more than 5% of requests on a given day.
robots.txt fetching needs care. A 200, or a 403, 404 or 410 meaning no file, counts as a success. A 429 or any 5XX error counts as a failure. Google says that after a failed robots.txt fetch it stops crawling for the first 12 hours, then uses the last good copy for up to 30 days. Our guide to checking robots.txt and noindex shows how to test the file.
DNS resolution fails when your DNS server does not recognise or answer for your hostname. Server connectivity fails when your server does not respond or sends an incomplete answer. On cheap shared hosting, a traffic spike, such as results day on an education site, is a common time for server connectivity to fail, so check the report after one.
Read the 4 breakdown tables
Below the chart, four tables split the crawl requests. Click any row for example URLs. Google says these are representative, not complete.
| Breakdown | Groups Google shows |
|---|---|
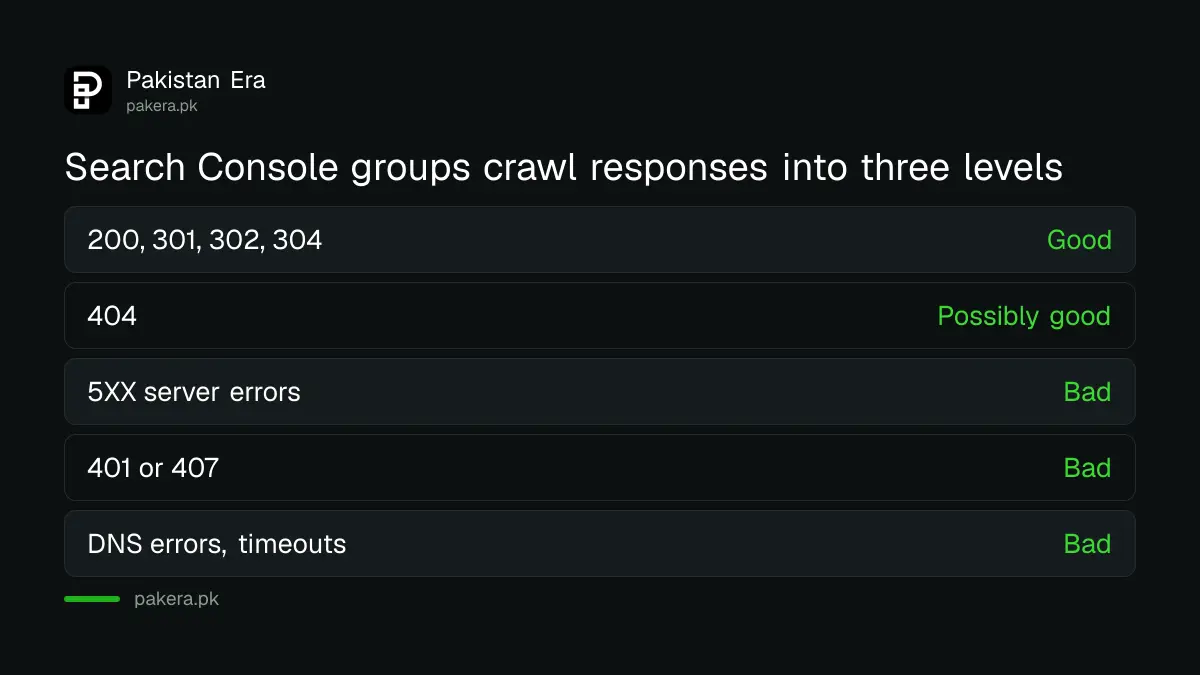
| By response | Good: 200, 301 or 308, 302 or 307, meta refresh, 304. Possibly good: 404. Bad: 5XX, 401 or 407, other 4XX, DNS errors, timeouts, redirect errors |
| By file type | HTML, Image, Video, JavaScript, CSS, PDF, JSON, Other XML and others |
| By purpose | Discovery for new URLs, Refresh for pages Google already knows |
| By Googlebot type | Smartphone, Desktop, Image, Video, Page resource load, AdsBot, StoreBot, Other |
A high share of 404s is "possibly good" if those pages are truly gone, but check for broken internal links. Any share of 5XX errors is bad and needs fixing. For a news site, a healthy Discovery share means Google is finding new articles quickly.
Fix the common crawl problems
Google's help page covers three main problems. Here is what it says to do for each.
Google crawls too much and slows your server. Google suggests returning a 503 or 429 status when the server is near capacity, or temporarily blocking the overloading crawler in robots.txt, which can take up to a day to work. Do not keep either in place for more than two or three days. Our guide to fixing server overload from Googlebot has the details.
Google crawls too little. You cannot ask Google for a higher crawl rate. Google says to keep your sitemaps up to date and check that pages are not blocked. See our guide to submitting a sitemap.
The crawl rate dropped. Google lists possible causes: a new or broad robots.txt rule, slow responses, more server errors, or content that rarely changes or is low quality. Check them in that order, because the first three are quick to rule out.
If AdsBot shows a spike, Google says it is often caused by many new Dynamic Search Ads targets, and that AdsBot crawls about every 2 weeks. So fix the ad setup, or the spike returns.
When the report differs from your server logs
Google says the report has a known issue: some requests may not be counted, so numbers can differ slightly from your logs. If Search Console shows far more requests than your logs, Google says this is often because robots.txt was unavailable for a long time, so Google counted crawls it did not make.
If your crawl totals look fine but pages still do not appear in search, the problem is indexing, not crawling. Use our guide to fixing pages not indexed next.
Common questions
Where is Crawl stats in Search Console?
Click Settings in the left menu, then Open report next to Crawl stats. It is not in the main report list.
Why can I not see the Crawl Stats report?
Google says it works only for root level properties. A folder property such as /blog/ will not show it. Add a Domain property instead.
What does "Recent issue" in host status mean?
Google had a significant availability problem with your site in the last week, from robots.txt fetching, DNS or server connectivity. Click it to see which one.
Can I ask Google to crawl my site more often?
No. Google says you cannot request a higher crawl rate. Keep sitemaps updated and make sure pages are not blocked.
Is a 404 in Crawl stats bad?
Not always. Google calls 404 "possibly good" if the page is really gone. Check that your own links do not point to it.
How long does Google keep crawl stats?
Host status looks back over the past 90 days. Child domain views list the top 20 child domains that got traffic in the same 90 days.
How we verified this
What we checked, where we read it, and what we could not confirm.
Last checked 10 November 2026. Source: Search Console Help, Crawl Stats report.
About the author

Founder and Editor
Umer Kureshi founded Pakistan Era in July 2024 and runs it as administrator, SEO lead and writer, overseeing website operations, search growth, content strategy and coverage of technology and current affairs.