Punjab AQI Today, 6 November 2026: Khanewal Worst at 245, Lahore Eases to 153 (All 35 Cities)
Punjab EPA put Khanewal's AQI at 245 at 2 pm on 6 November 2026, the worst of 35 cities, while Lahore fell to 153 from 216. See every city and Lahore station.
یہ صفحہ اردو میں پڑھیں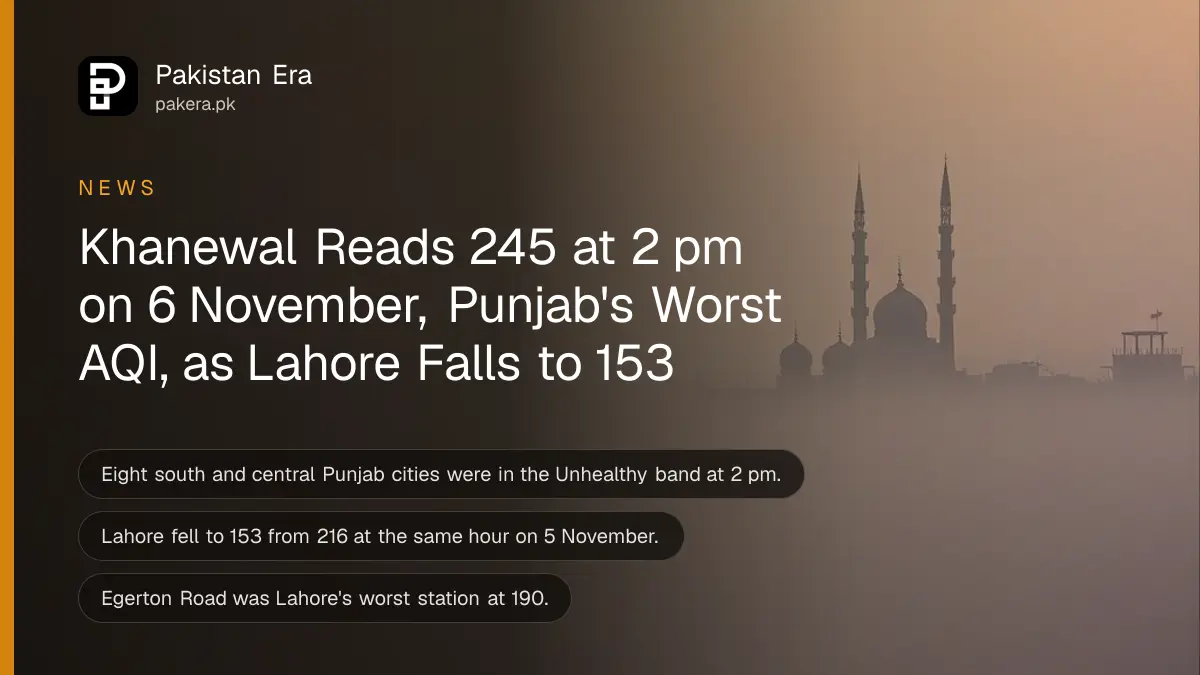
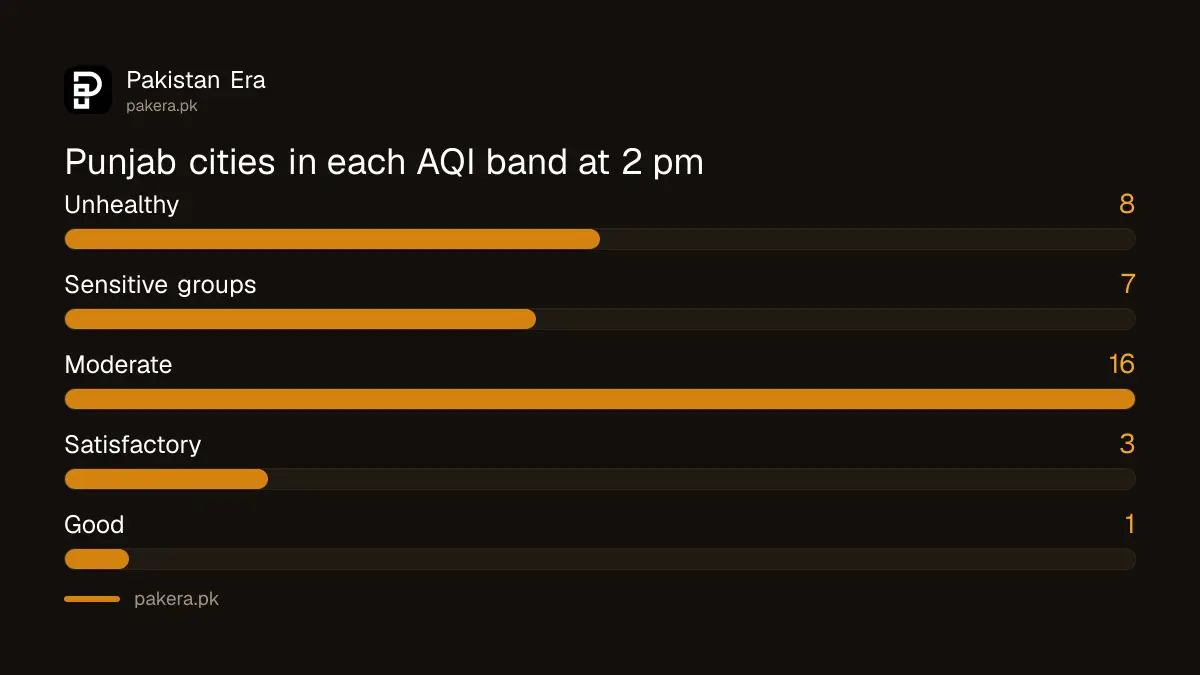
Short answer: At 2 pm on 6 November 2026, Punjab EPA's official dashboard put Khanewal at AQI 245, the worst of 35 Punjab cities, followed by Muzaffargarh at 237. Lahore read 153, "Unhealthy for sensitive groups", down from 216 at the same hour on 5 November. Eight cities, all in south and central Punjab, were in the Unhealthy band. No city was Very Unhealthy or Hazardous.
The smog moved south on Friday. A day after Lahore topped the province at night, the afternoon reading showed the worst air along a belt from Khanewal and Muzaffargarh to Bahawalpur, Sahiwal and Rahim Yar Khan. We read the Punjab EPA dashboard at about 3 pm PKT, when it showed "Last updated: 2:00 PM, Nov 6". Here is every city, every Lahore station and what the province's own advice says.
Khanewal had Punjab's worst air at 2 pm on 6 November
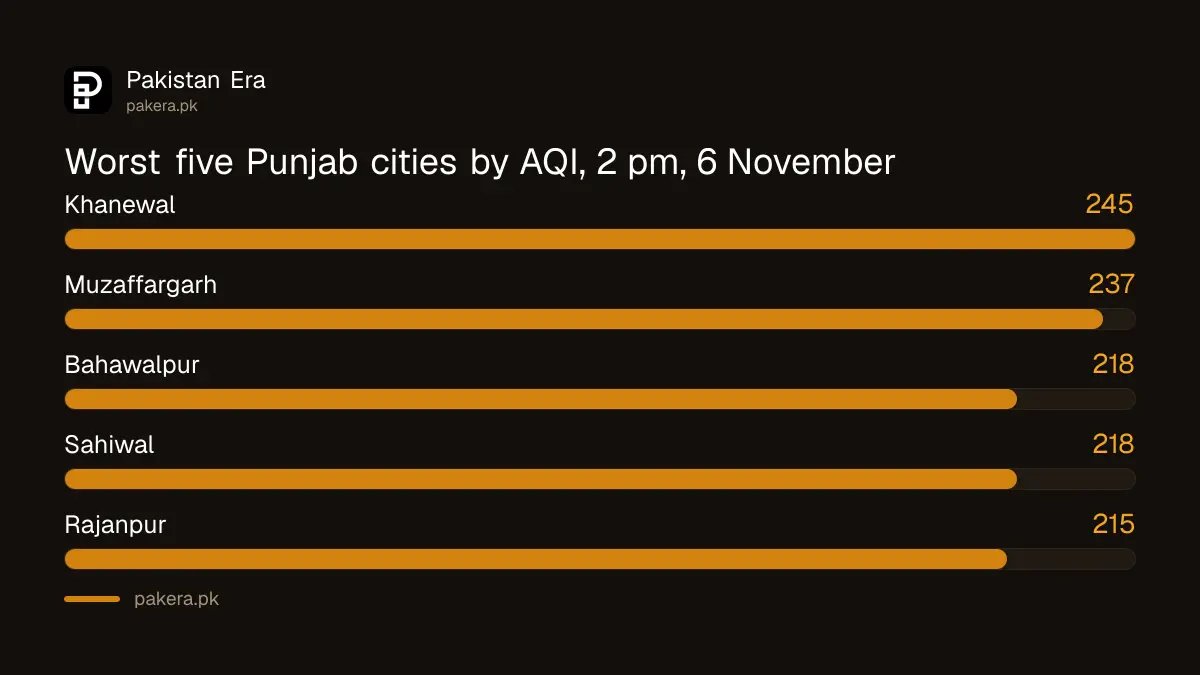
Khanewal read 245 and Muzaffargarh 237, both in the Unhealthy band of 201 to 300. Bahawalpur and Sahiwal tied on 218, Rajanpur read 215, and Rahim Yar Khan and Pakpattan tied on 212. Vehari, at 208, was the eighth Unhealthy city.
All eight sit in south or central Punjab. In each of them the main pollutant on the dashboard was PM2.5, the fine dust small enough to reach deep into the lungs. Khanewal's station showed PM2.5 at 194 micrograms per cubic metre and Muzaffargarh's at 186.8.
All 35 Punjab cities ranked
The dashboard ranked 35 cities. The bands below are Punjab EPA's own: Good 0 to 50, Satisfactory 51 to 100, Moderate 101 to 150, Unhealthy for sensitive groups 151 to 200, Unhealthy 201 to 300, Very Unhealthy 301 to 400 and Hazardous 401 to 500.
| Rank | City | AQI at 2 pm | Band |
|---|---|---|---|
| 1 | Khanewal | 245 | Unhealthy |
| 2 | Muzaffargarh | 237 | Unhealthy |
| 3 | Bahawalpur | 218 | Unhealthy |
| 4 | Sahiwal | 218 | Unhealthy |
| 5 | Rajanpur | 215 | Unhealthy |
| 6 | Rahim Yar Khan | 212 | Unhealthy |
| 7 | Pakpattan | 212 | Unhealthy |
| 8 | Vehari | 208 | Unhealthy |
| 9 | Multan | 193 | Sensitive groups |
| 10 | Okara | 192 | Sensitive groups |
| 11 | Kot Addu | 184 | Sensitive groups |
| 12 | Kasur | 179 | Sensitive groups |
| 13 | DG Khan | 172 | Sensitive groups |
| 14 | Narowal | 156 | Sensitive groups |
| 15 | Lahore | 153 | Sensitive groups |
| 16 | Nankana Sahib | 141 | Moderate |
| 17 | Jhang | 134 | Moderate |
| 18 | Faisalabad | 133 | Moderate |
| 19 | Sialkot | 129 | Moderate |
| 20 | Sheikhupura | 127 | Moderate |
| 21 | Bhakkar | 124 | Moderate |
| 22 | Hafizabad | 123 | Moderate |
| 23 | Murree | 117 | Moderate |
| 24 | Gujranwala | 109 | Moderate |
| 25 | Talagang | 107 | Moderate |
| 26 | Sargodha | 106 | Moderate |
| 27 | Rawalpindi | 105 | Moderate |
| 28 | Khushab | 105 | Moderate |
| 29 | Gujrat | 104 | Moderate |
| 30 | Attock | 103 | Moderate |
| 31 | Wazirabad | 103 | Moderate |
| 32 | Mianwali | 94 | Satisfactory |
| 33 | Mandi Bahauddin | 92 | Satisfactory |
| 34 | Chakwal | 73 | Satisfactory |
| 35 | Jhelum | 8 | Good (doubtful, see below) |
Treat Jhelum's 8 with care. Its station showed no PM2.5 or PM10 figure at all, only carbon monoxide, so the number most likely reflects missing dust readings rather than clean air. Chiniot's station had no reading since 3 November and was not ranked.
Lahore read 153, with Egerton Road the worst station
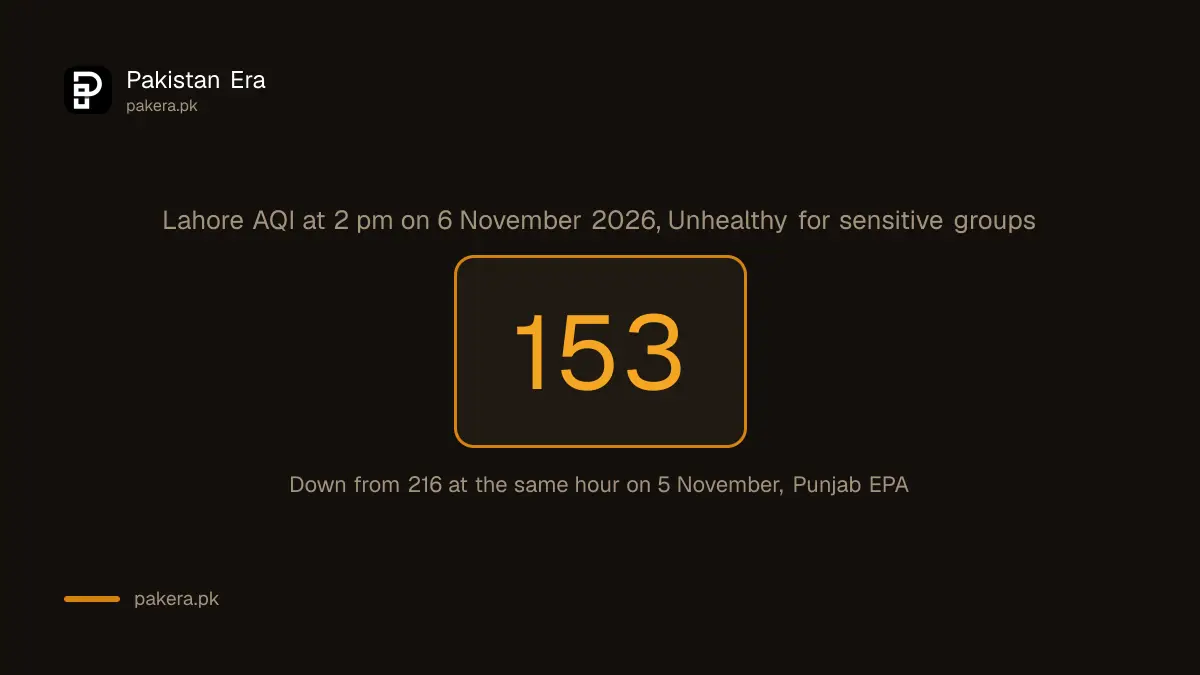
Lahore's figure of 153 was 63 points lower than the 216 the dashboard showed for the same hour on 5 November. Egerton Road was the worst of Lahore's stations at 190, then Multan Road at 174 and Kahna Nau at 163. Wagha Border was cleanest at 106.
| Lahore station | AQI at 2 pm | PM2.5 (µg/m³) | PM10 (µg/m³) |
|---|---|---|---|
| Egerton Road | 190 | 134.9 | 206.6 |
| Multan Road | 174 | 109.6 | 257.8 |
| Kahna Nau | 163 | 94.0 | 248.0 |
| Barki Road | 161 | 91.0 | 244.5 |
| Punjab University | 158 | 86.0 | 200.3 |
| GT Road | 158 | 86.3 | 211.5 |
| Shahdara | 156 | 83.0 | 163.1 |
| DHA Phase 6 | 148 | 73.3 | 181.3 |
| Gulberg III | 120 | 50.2 | 188.6 |
| Wagha Border | 106 | 37.4 | 128.8 |
Safari Park, Lahore's worst station overnight on 5 November, showed 169 in its 1 pm reading and was missing from the 2 pm town list. We checked the arithmetic: the average of the ten stations above is 153.4, which matches the city figure. Our guide to Lahore AQI area by area shows where each station is.
Afternoon readings are not the whole day. At 3 am on 5 November the same dashboard had Lahore at 395, as our 5 November report recorded. Check again in the evening before planning an early morning outing.
What Punjab EPA advises at these levels
For the Unhealthy band, the advice is to wear a face mask outdoors and avoid heavy or long outdoor activity. Vulnerable people should stay indoors as much as possible, use an N95 mask if they must go out and keep children indoors unless it is necessary.
For Lahore's band, Unhealthy for sensitive groups, the dashboard tells the general public to reduce long or heavy outdoor effort. For vulnerable groups it lists:
- Check the AQI before going out.
- Wear a mask outdoors and keep children indoors.
- Elderly people should stay indoors, with doors and windows closed.
- Avoid travel in poor AQI areas and heavy outdoor activity.
- COPD and heart patients should ask their doctor which mask to use.
Vulnerable groups include children, older people, pregnant women and people with asthma, lung or heart disease. Our guides on which mask works in smog and protecting children and older parents go further. To report a smoky kiln or crop burning, use the Green Punjab app.
Common questions
Which Punjab city had the worst AQI on 6 November 2026?
Khanewal, at 245 in the 2 pm reading, followed by Muzaffargarh at 237. Both were in the Unhealthy band.
What was Lahore's AQI on 6 November 2026?
153 at 2 pm, Unhealthy for sensitive groups, down from 216 at the same hour on 5 November.
Did any city reach Hazardous?
No. At 2 pm no Punjab city was Very Unhealthy or Hazardous. The highest was Khanewal at 245.
Is Jhelum's air really that clean?
Probably not. Its station gave no dust readings, so the figure of 8 is doubtful. Use a nearby city such as Gujrat or Chakwal as a guide.
Are schools closed for smog?
We did not find a new closure order on the Environment Protection Department website on 6 November. Our guide to checking smog school closures shows where an official order appears.
Where can I check the live AQI?
On Punjab EPA's dashboard at aqi.punjab.gov.pk. Our guide to checking Lahore's air quality shows how it works.
How we verified this
What we checked, where we read it, and what we could not confirm.
Last checked on 6 November 2026 at about 3 pm PKT, when the Punjab EPA AQI dashboard showed its 2 pm reading. City ranks, station values, Lahore's same-hour figure for 5 November and the advice are from that dashboard and its health advisory page. The station averages are our own arithmetic. Readings change every hour.
About the author

Public Services and Education Journalist
Fajr Riaz is a journalist and content writer at Pakistan Era, based in Lahore. She covers the questions people meet in everyday life in Pakistan: how a public service works, what a change in the rules means, and where to find a reliable answer.