How to Check Tarbela and Mangla Dam Levels on IRSA's Daily Sheet: 1,518.71 and 1,198.65 Feet on 16 October 2026
IRSA's daily water sheet put Tarbela at 1,518.71 feet and Mangla at 1,198.65 on 16 October 2026, with Sindh getting 44,000 cusecs. Here is how to read it, free.
Tarbela stood at 1,518.71 feet and Mangla at 1,198.65 feet on 16 October 2026, the latest daily water situation sheet on the Indus River System Authority's site when we checked on 19 October. Tarbela is 31 feet below its 1,550 foot maximum and Mangla has dropped 4.75 feet in a week as Rabi drawdown begins. The sheet is a one-page PDF, free, posted most days at pakirsa.gov.pk under Daily Data.
IRSA is the federal body that shares Indus water between the four provinces under the 1991 Water Apportionment Accord. Its daily sheet is the only official page that puts the two big dams, the Chashma reservoir, the barrage flows and each province's share on one sheet. We opened the sheets for 9 October and 16 October 2026 and set them side by side below.
The sheet lives under Daily Data on pakirsa.gov.pk and opens only over http
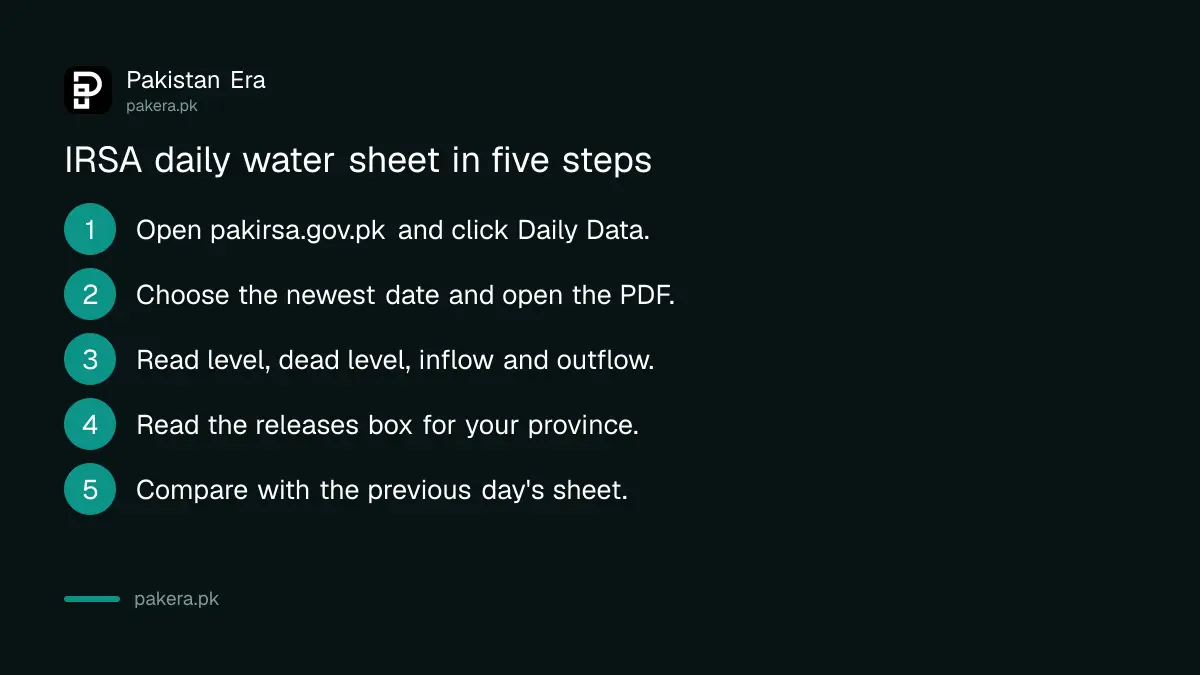
Go to pakirsa.gov.pk, click Daily Data in the top menu, and pick the date. Each date is a PDF named like Data16-10-2026.pdf. On 19 October the newest sheet was for 16 October, so expect a lag of a day or three. In our test the site refused the https address and only answered on plain http, so if your browser shows an error, try the address without the s.
- Open pakirsa.gov.pk and click Daily Data.
- Choose the latest date in the list and open the PDF.
- Read Level, Dead Level, Mean Inflow and Mean Outflow for Tarbela and Mangla.
- Read the IRSA Releases box for your province's share in cusecs, today and last year.
- Compare with the previous day's sheet, which the site keeps for about a week.
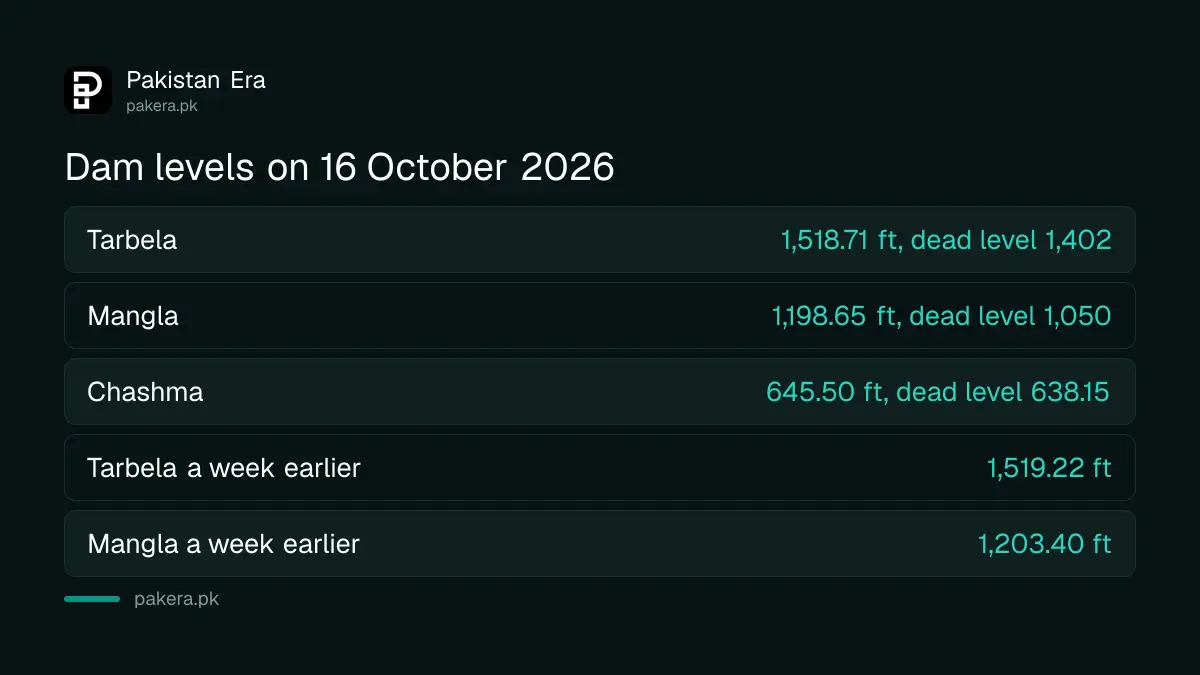
Tarbela was at 1,518.71 feet on 16 October, Mangla at 1,198.65
The sheet prints each reservoir's level in feet above sea level and its dead level, the point below which water cannot be drawn for irrigation. On 16 October Tarbela read 1,518.71 feet against a dead level of 1,402 feet, so it held about 117 feet of usable depth. Mangla read 1,198.65 feet against a dead level of 1,050 feet, about 149 feet of usable depth.
| Reservoir | 9 October 2026 | 16 October 2026 | Dead level | Change in a week |
|---|---|---|---|---|
| Tarbela level, feet | 1,519.22 | 1,518.71 | 1,402.00 | Down 0.51 |
| Tarbela inflow, cusecs | 56,300 | 43,300 | Down 13,000 | |
| Tarbela outflow, cusecs | 60,000 | 45,000 | Down 15,000 | |
| Mangla level, feet | 1,203.40 | 1,198.65 | 1,050.00 | Down 4.75 |
| Mangla inflow, cusecs | 8,964 | 6,951 | Down 2,013 | |
| Mangla outflow, cusecs | 37,000 | 16,000 | Down 21,000 | |
| Chashma level, feet | 645.60 | 645.50 | 638.15 | Down 0.10 |
The sheet does not print the full level. For Tarbela, WAPDA's own project page gives a maximum elevation of 1,550 feet and a minimum operating level of 1,378 feet, which we read on 19 October. So Tarbela was 31.29 feet below full on 16 October. WAPDA's Mangla page gives the raised crest of 1,264 feet but not the conservation level, so we do not state one for Mangla.
Mangla is releasing more than twice what flows in
Read inflow against outflow and you can see the season turn. On 16 October Tarbela took in 43,300 cusecs and let out 45,000, a small net draw. Mangla took in 6,951 cusecs and let out 16,000, so it was releasing 2.3 times its inflow. That is why its level fell 4.75 feet in the week while Tarbela fell half a foot.
A cusec is one cubic foot of water a second. The sheet uses it for every flow, and the same unit appears in PMD's flood bulletins, which the guide to PMD's river flood limits in cusecs explains. On 9 October Mangla had been releasing 37,000 cusecs against 8,964 in, so the heavy early-Rabi drawdown had already eased by the 16th.
The sheet also totals the four rim stations, Indus at Tarbela, Jhelum at Mangla, Kabul at Nowshera and Chenab at Marala. Rim inflows were 85,548 cusecs on 16 October, up 4,395 or 5 per cent on the day before, and outflows 96,297 cusecs. A week earlier inflows had been 95,190 cusecs, so the rivers lost about 10 per cent in seven days.
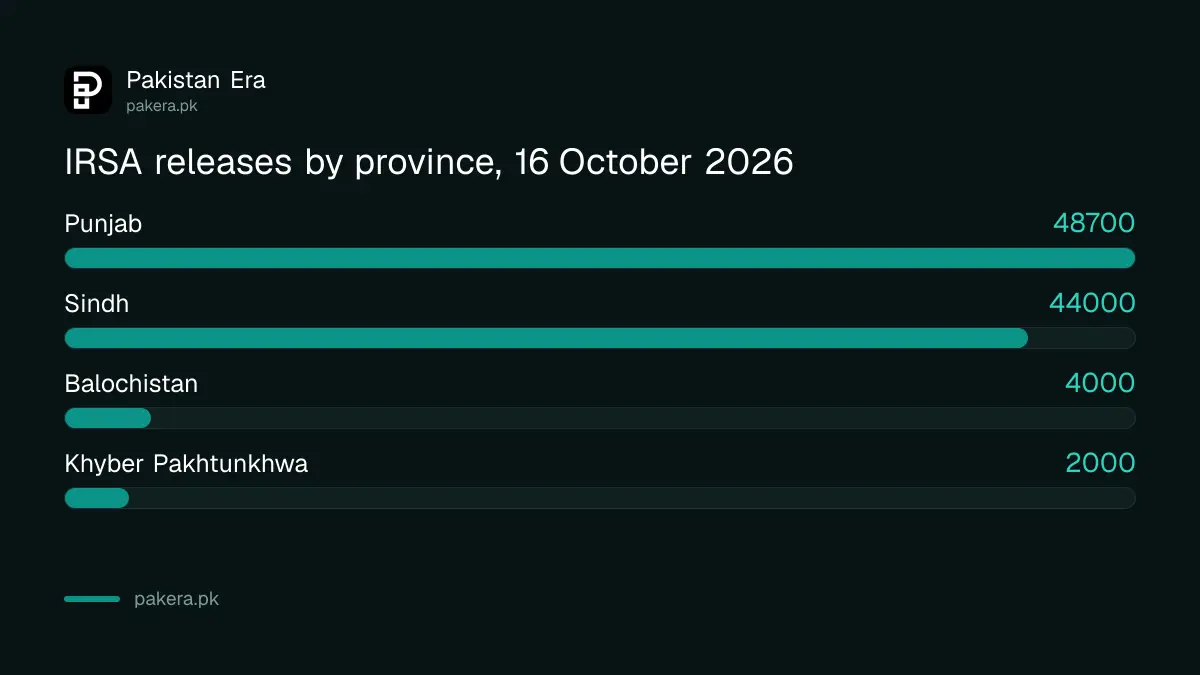
The releases box shows what each province got, today and a year ago
The bottom right of the sheet is the part most farmers want. It lists IRSA's releases to each province for the day and for the same date a year earlier. On 16 October 2026 Punjab got 48,700 cusecs, Sindh 44,000, Khyber Pakhtunkhwa 2,000 and Balochistan 4,000. On 16 October 2025 the figures were 44,900, 60,000, 2,500 and 4,000.
| Province | 16 October 2026 | 16 October 2025 | Change |
|---|---|---|---|
| Punjab | 48,700 cusecs | 44,900 cusecs | Up 8 per cent |
| Sindh | 44,000 cusecs | 60,000 cusecs | Down 27 per cent |
| Khyber Pakhtunkhwa | 2,000 cusecs | 2,500 cusecs | Down 20 per cent |
| Balochistan | 4,000 cusecs | 4,000 cusecs | No change |
| Total | 98,700 cusecs | 111,400 cusecs | Down 11 per cent |
The sheet carries a footnote that Khyber Pakhtunkhwa and Balochistan are exempt from shortages. The 22 per cent Rabi shortage that IRSA warned of is in the federal Rabi plan, set out in our report on the Rabi 2026-27 plan for urea, DAP and water. The daily sheet is where you can watch that shortage arrive, one day at a time.
Kotri let nothing past to the sea on 16 October
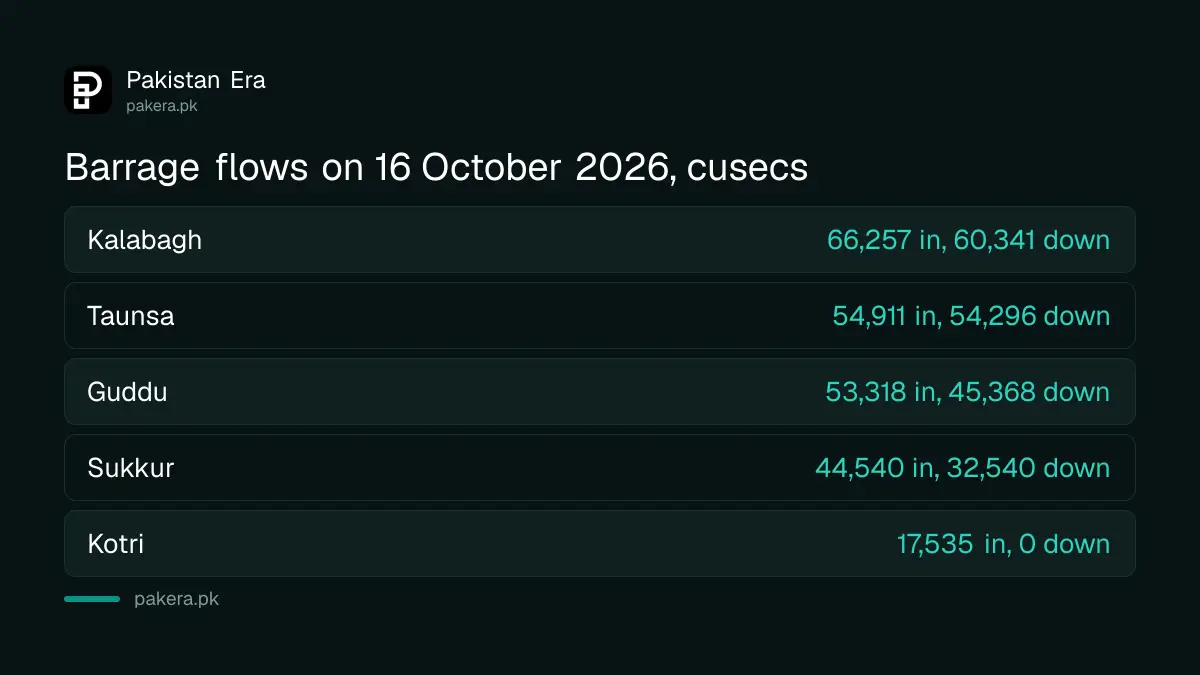
The sheet also lists the barrages. Kotri, the last barrage on the Indus before the delta, had 17,535 cusecs arriving on 16 October, all of it taken by canals, and a downstream discharge of zero. On 9 October the downstream figure had been 514 cusecs. Sukkur passed 32,540 cusecs downstream after canals took 12,000, and Guddu passed 45,368 after canals took 7,950.
Farther up, Chashma took in 60,040 cusecs and let out 54,000, with the Chashma Jhelum link carrying 5,990 of that across to the Jhelum side, while the Taunsa Panjnad link and the Muzaffargarh and Dera Ghazi Khan canals all read zero. Those zeros are canal closures or rotations, not errors. If a canal in your area reads a number on the sheet but your watercourse is dry, the steps to report canal water theft or a dry tail in Punjab start with the irrigation helpline.
What the sheet does not tell you
It gives no storage volume in million acre feet, no forecast and no reason for a change. It does not say when the next sheet will appear, and the gap we saw was three days. For daily river readings with a flood warning attached, PMD's bulletin is the better source, and the guide to reading PMD's daily flood bulletin covers it. In our test of flood sites in August, only one updated every day; the IRSA sheet is slower but it is the only one with provincial shares.
Common questions
What is the Tarbela dam level today?
The latest IRSA sheet when we checked, for 16 October 2026, put Tarbela at 1,518.71 feet. Open pakirsa.gov.pk, click Daily Data and choose the newest date for today's figure.
What is the Mangla dam level?
1,198.65 feet on 16 October 2026, down from 1,203.40 feet on 9 October. Its dead level is 1,050 feet.
Is Tarbela full?
No. WAPDA gives its maximum as 1,550 feet, so it was 31.29 feet below full on 16 October 2026.
How much water is Sindh getting?
44,000 cusecs on 16 October 2026, against 60,000 cusecs on the same date in 2025, according to the IRSA sheet.
What is a cusec?
One cubic foot of water passing a point each second. IRSA, WAPDA and PMD all use it for river and canal flows.
Why does Kotri downstream read zero?
Because all 17,535 cusecs reaching Kotri on 16 October went into canals. The sheet gives the number, not the reason.
How we verified this
What we checked, where we read it, and what we could not confirm.
Last checked 19 October 2026. All levels, inflows, outflows, barrage discharges, canal withdrawals, rim station totals, provincial releases and the last-year figures come from the IRSA Daily Water Situation sheets for 9 and 16 October 2026 at pakirsa.gov.pk Daily Data, which we downloaded and read on 19 October 2026. Tarbela's maximum and minimum operating levels are from WAPDA's Tarbela Dam page, read the same day. The weekly changes, percentages, usable depths and the Mangla release ratio are our arithmetic. We could not find Mangla's conservation level on an official page and do not state one. The site did not answer over https in our test.
About the author

Senior Writer, Public Services and Technology
Shahid joined us in 2024 as an author. He is a senior contributor to Pakistan's leading technology websites. He writes detailed articles, mostly covering his expertise in the latest tech, mobiles, apps, gadgets, and step-by-step guides. His ideology is to help people understand the latest trends and explain complex methods through very easy-to-understand guides.