Islamabad AQI 15 November 2026: 151 Unhealthy, Evening Dust Twice the Afternoon Level (Pak-EPA Table)
Pak-EPA put Islamabad's PM2.5 AQI at 151, Unhealthy, on 15 November 2026, with fine dust 1.6 times the limit and evening carbon monoxide near 5,000. Full table.
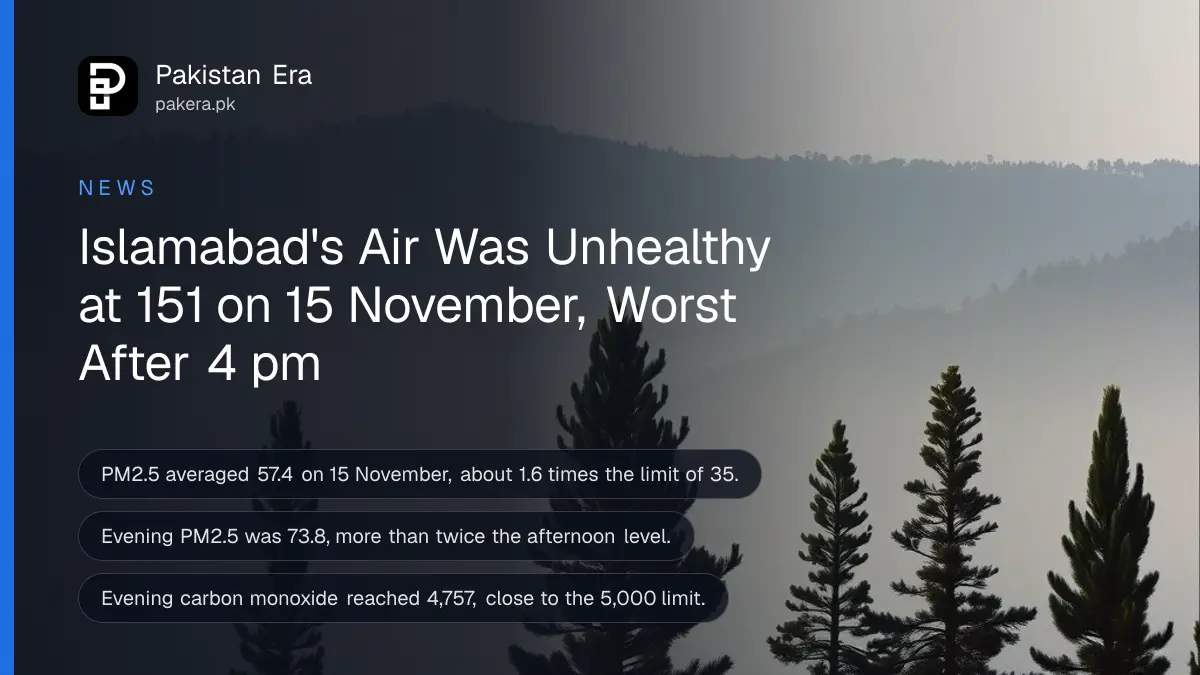
Short answer: Islamabad's air was Unhealthy on Sunday 15 November 2026. The Pakistan Environmental Protection Agency (Pak-EPA) gave fine dust, PM2.5, an AQI of 151. The 24 hour average was 57.4 micrograms per cubic metre, against a national limit of 35.
Pak-EPA posted the 15 November table on its website on 16 November, under "Air Quality Index of Islamabad". That is the fifth Unhealthy day in a row among the Pak-EPA tables we have read since 29 October. Each one sits between 151 and 173.
The three gases Pak-EPA measures, sulphur dioxide, carbon monoxide and nitrogen dioxide, stayed in the Good band. Fine dust was again the only pollutant over the limit. Carbon monoxide came close to its limit in the evening, which matters for anyone running a gas heater indoors.
Islamabad's PM2.5 averaged 57.4 on 15 November, 1.6 times the limit
Islamabad's PM2.5 averaged 57.4 micrograms per cubic metre over 24 hours on 15 November. The National Environmental Quality Standard (NEQS), the legal limit Pak-EPA uses, is 35. That is about 1.6 times the allowed level, by our arithmetic.
PM2.5 means dust and smoke particles smaller than 2.5 micrometres. They pass deep into the lungs and can enter the blood. The AQI of 151 sits at the very bottom of the Unhealthy band, which runs from 151 to 200 on Pak-EPA's table.
Here is the 15 November table in Pak-EPA's own figures:
| Pollutant | 24 hour average | NEQS limit | AQI | Band |
|---|---|---|---|---|
| Sulphur dioxide (SO2) | 18.6 | 120 | 26 | Good |
| Carbon monoxide (CO) | 2,083.4 | 5,000 | 23 | Good |
| Nitrogen dioxide (NO2) | 7.4 | 80 | 7 | Good |
| Fine dust (PM2.5) | 57.4 | 35 | 151 | Unhealthy |
All values are in micrograms per cubic metre. The AQI is the number Pak-EPA printed beside each one.
The air was cleanest in the afternoon and worst after 4 pm
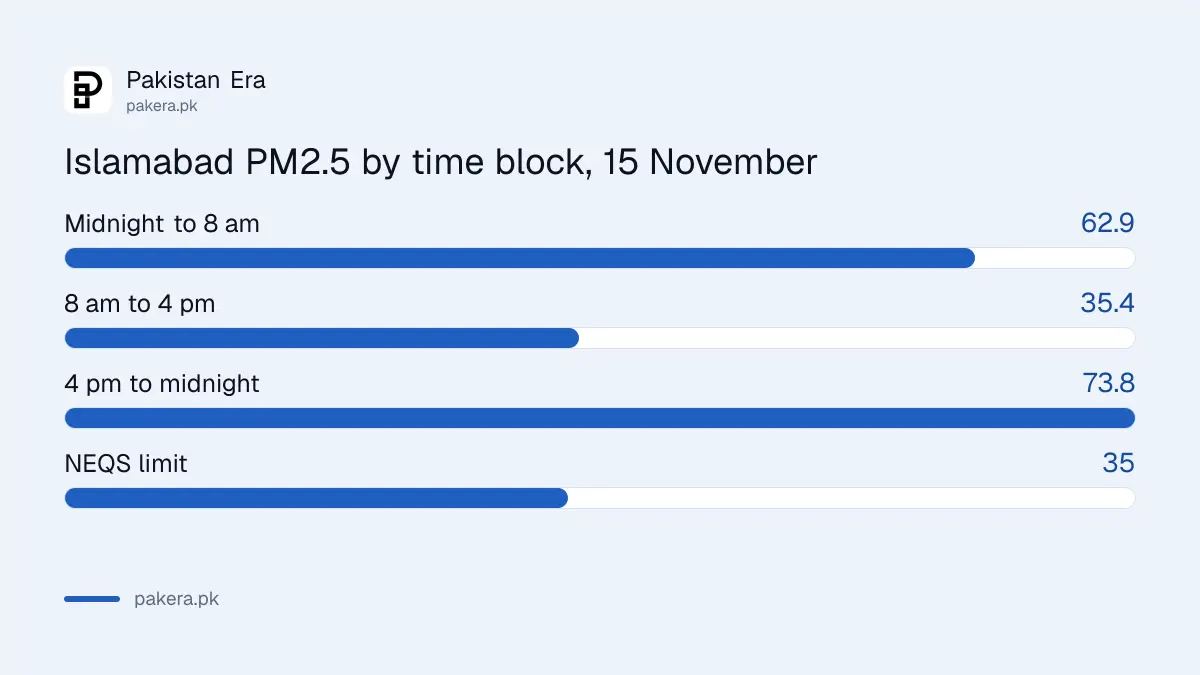
Pak-EPA splits each day into three eight hour blocks. On 15 November PM2.5 was 62.9 from midnight to 8 am, fell to 35.4 from 8 am to 4 pm, then rose to 73.8 from 4 pm to midnight. The afternoon block was only just over the limit.
| Time block, 15 November | PM2.5 | CO | NO2 | SO2 |
|---|---|---|---|---|
| 00:10 to 08:00 | 62.9 | 1,161.9 | 7.2 | 18.2 |
| 08:10 to 16:00 | 35.4 | 331.1 | 6.8 | 17.9 |
| 16:10 to 00:00 | 73.8 | 4,757.3 | 8.3 | 19.7 |
| 24 hour average | 57.4 | 2,083.4 | 7.4 | 18.6 |
That pattern matters for planning. A walk or school sports in the early afternoon met far cleaner air than the same activity after dark. The evening block was more than twice as dusty as the afternoon one.
Evening carbon monoxide reached 4,757, near the 5,000 limit
Carbon monoxide jumped from 331.1 in the afternoon to 4,757.3 between 4 pm and midnight. That is about 95 per cent of the 5,000 figure Pak-EPA prints as the limit, by our arithmetic. The daily average, 2,083.4, kept CO in the Good band.
The same evening rise showed up on 11 November, when the 4 pm to midnight block reached 5,095.9 and crossed the limit. Evening traffic and burning fuel for heat both add carbon monoxide. Indoors, a gas heater in a closed room can push it far higher, and the gas has no smell. Safe heater rules are in how to use a gas heater or geyser safely.
Five Pak-EPA readings since late October, all Unhealthy
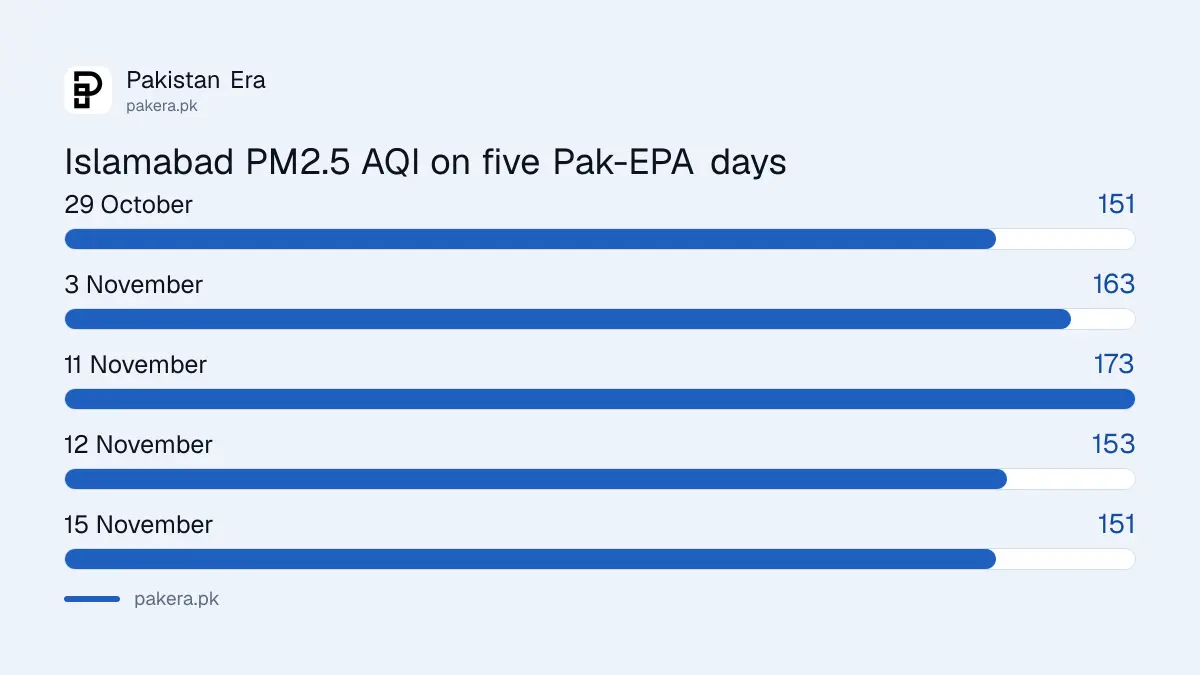
All five Islamabad tables we have read since 29 October put PM2.5 in the Unhealthy band. The AQI has moved between 151 and 173. Pak-EPA does not post every day, so there are gaps between the dates.
| Day | PM2.5 average | PM2.5 AQI | Times the limit |
|---|---|---|---|
| 29 October 2026 | 56.7 | 151 | 1.6 |
| 3 November 2026 | 79.3 | 163 | 2.3 |
| 11 November 2026 | 99.2 | 173 | 2.8 |
| 12 November 2026 | 60.9 | 153 | 1.7 |
| 15 November 2026 | 57.4 | 151 | 1.6 |
The 11 and 12 November tables are in Islamabad AQI on 12 November. For a longer view, Pak-EPA's monthly report put October's PM2.5 average at 54.6, so mid November is running a little above last month. September's monthly figures are in Islamabad air quality in September.
What to do in Islamabad on Unhealthy days
An AQI of 151 to 200 is Unhealthy. Healthy adults may feel little. Children, older people, pregnant women and anyone with asthma, lung or heart disease can react, so they should cut long or hard activity outdoors.
- Move walks and outdoor exercise to the early afternoon. On 15 November that block was the cleanest of the day.
- Close windows in the evening, when both dust and carbon monoxide peaked.
- Use a fitted N95 or KN95 mask outdoors. A cloth mask does little against fine dust.
- Never run a gas heater in a closed room overnight. Switch it off before you sleep.
- Keep inhalers and medicines close, and see a doctor if breathing gets harder.
To read Pak-EPA's table yourself, open environment.gov.pk, find "Air Quality Index of Islamabad" in the Latest News box, open the table image and check the date printed at the top. The steps are set out in how to check Islamabad's AQI on Pak-EPA. Rawalpindi is in Punjab, so its hourly reading comes from Punjab EPA, which uses different stations and methods.
Common questions
What was Islamabad's AQI on 15 November 2026?
Pak-EPA gave PM2.5 an AQI of 151, which is Unhealthy. The other three pollutants were Good.
How far above the limit was Islamabad's PM2.5 on 15 November?
The 24 hour average was 57.4, about 1.6 times the national limit of 35.
When was Islamabad's air cleanest on 15 November?
From 8 am to 4 pm, when PM2.5 was 35.4, just over the limit. The evening block was worst at 73.8.
Did carbon monoxide cross the limit on 15 November?
No. It reached 4,757.3 in the evening block, close to the 5,000 limit, and averaged 2,083.4 for the day.
Does Pak-EPA post Islamabad's AQI every day?
No. Tables appear on some days only, usually a day after the date they cover.
Is Islamabad's AQI the same as Rawalpindi's?
No. Islamabad's figure comes from Pak-EPA as a 24 hour average. Rawalpindi's comes from Punjab EPA's hourly dashboard, so the two should not be compared one for one.
How we verified this
What we checked and where we read it.
We read the table on the Pak-EPA website early on 17 November 2026. The home page Latest News box listed "Air Quality Index of Islamabad" dated 16 November 2026, and that item opens the table image headed "Air Quality Index of Islamabad on 15-11-2026". The October average is from Pak-EPA's monthly "Ambient Air Quality Data with AQI of Islamabad (October, 2026)" report on the same site. The 29 October, 3, 11 and 12 November figures come from our earlier readings of Pak-EPA's tables. The "times the limit" column and the carbon monoxide percentage are our arithmetic.
About the author

Senior Writer, Public Services and Technology
Shahid joined us in 2024 as an author. He is a senior contributor to Pakistan's leading technology websites. He writes detailed articles, mostly covering his expertise in the latest tech, mobiles, apps, gadgets, and step-by-step guides. His ideology is to help people understand the latest trends and explain complex methods through very easy-to-understand guides.