Multan AQI Today: Check Punjab EPA's 2 Multan Stations Live, Free (6 November: 193)
Check Multan AQI today on Punjab EPA's free dashboard. At 2 pm on 6 November 2026 Multan read 193, MNS UET 196 and BZU 189. Steps, bands, nearby cities.
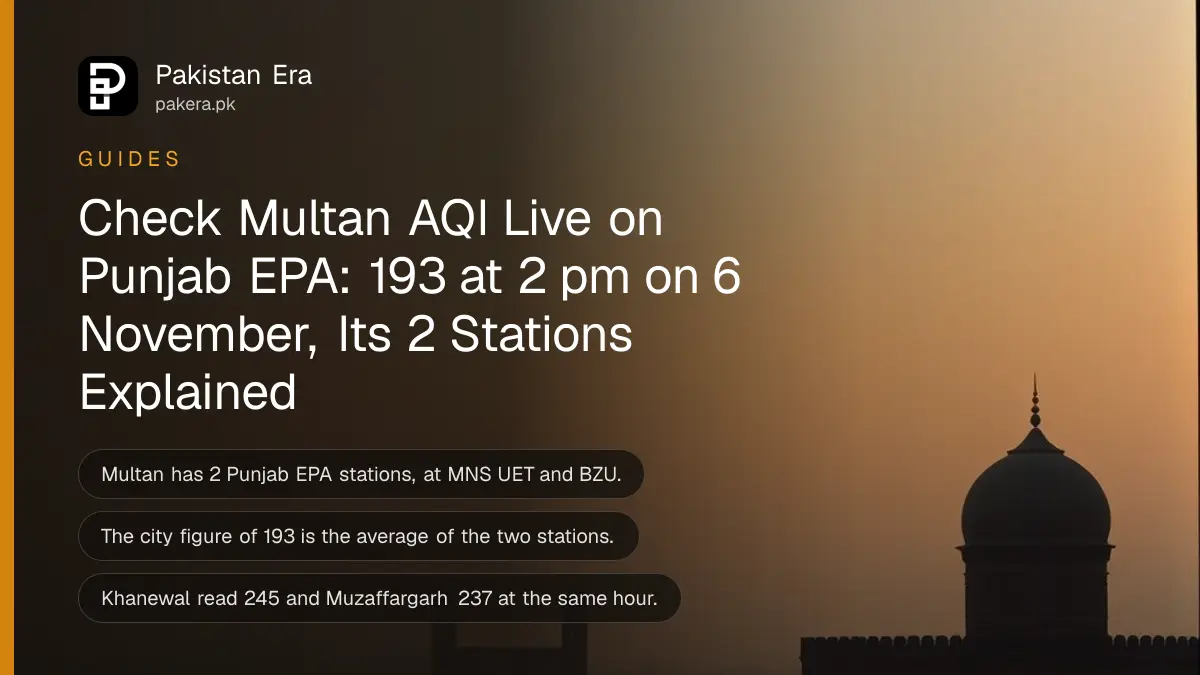
Short answer: Check Multan's AQI free on Punjab EPA's official dashboard at aqi.punjab.gov.pk, which updates every hour. At 2 pm on 6 November 2026 it put Multan at 193, "Unhealthy for sensitive groups", with MNS University of Engineering and Technology the highest of its 2 stations at 196. Multan's 193 was 40 points above Lahore's 153 at the same hour.
Multan has two Punjab EPA monitoring stations, one at Bahauddin Zakariya University (BZU) and one at MNS University of Engineering and Technology. The city's AQI is the average of the two. Below is how to read them, the 6 November figures as a worked example, what each band means and what to do on a bad day. We read every figure on the dashboard ourselves at about 3 pm on 6 November.
Multan AQI at 2 pm on 6 November 2026 was 193
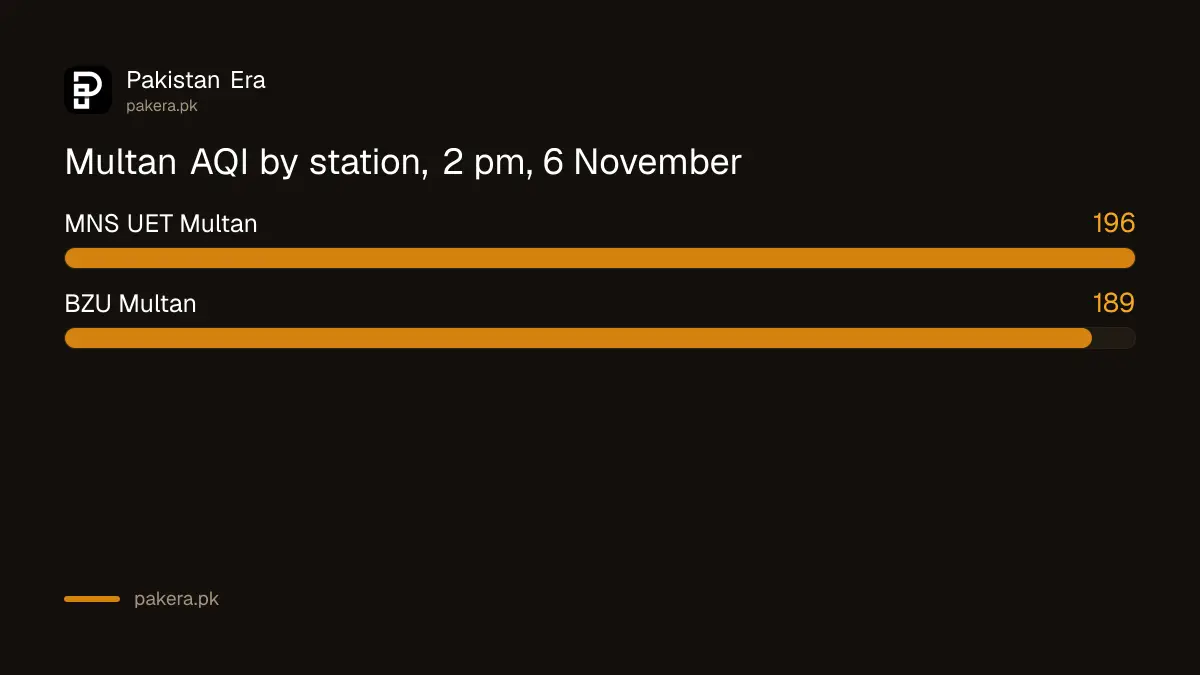
Punjab EPA's dashboard showed Multan at 193 in its 2 pm reading on 6 November, in the Unhealthy for sensitive groups band of the province's scale. Each station reports its own AQI along with PM2.5 and PM10, the two kinds of dust that drive smog readings.
| Station | AQI | Band | PM2.5 (µg/m³) | PM10 (µg/m³) | Main pollutant |
|---|---|---|---|---|---|
| MNS University of Engineering and Technology | 196 | Unhealthy for sensitive groups | 144.3 | 225.7 | PM2.5 |
| BZU Multan | 189 | Unhealthy for sensitive groups | 0.00 (fault) | 327.6 | PM10 |
Look closely at the BZU Multan row. Its PM2.5 reads 0.00, which is not possible in a city where the next station shows 144.3. A zero like that usually means the fine dust sensor is down. The station's AQI of 189 came from PM10, the coarser dust, so the true figure may be higher. The MNS University of Engineering and Technology station, where PM2.5 was working, read 196.
PM2.5 is fine dust, smaller than 2.5 micrometres, that can reach deep into the lungs. PM10 is coarser dust, up to 10 micrometres, from roads, building work and soil. µg/m³ means micrograms in each cubic metre of air.
How to check Multan's AQI on the Punjab EPA dashboard
Open aqi.punjab.gov.pk in any phone browser. It is free and needs no login. The dashboard shows Lahore first, then ranks every Punjab city by AQI, so Multan is a short scroll away.
- Open aqi.punjab.gov.pk and look for the "Last updated" time at the top, so you know which hour you are seeing.
- Scroll to "AQI Based City Ranking" and find Multan in the list. The number beside it is the city figure.
- Open the Map section to see each monitoring station plotted across Punjab, including Multan's 2.
- Open the Health Advisory page to see what that band means for you and for vulnerable family members.
- Use "Set AQI Alert", choose Multan as the district and allow browser notifications if you want a warning when the air gets worse.
The dashboard also links an Android app. Our guide to checking air quality on Punjab's AQI site covers the app and the Lahore views in more detail.
The city figure is the average of its stations
We checked this ourselves on 6 November. Multan's city AQI of 193 matches the plain average of its stations: (196 + 189) / 2 = 192.5. The same held in that reading for Multan, Faisalabad, Rawalpindi and Gujranwala, and for Lahore using the ten stations that reported at 2 pm.
That has a practical meaning. If you live next to the highest station, your air is likely worse than the city number. If you live near the lowest, it may be better. On days when one station is faulty, as a zero reading suggests, the average can also mislead. So check the station table, not just the headline figure.
Readings also swing a lot in a day. At 3 am on 5 November the same dashboard had Lahore at 395, while at 2 pm on 6 November it was 153. Our Punjab AQI report for 6 November ranks all 35 cities at the same hour.
What each AQI band means, in Punjab EPA's own words
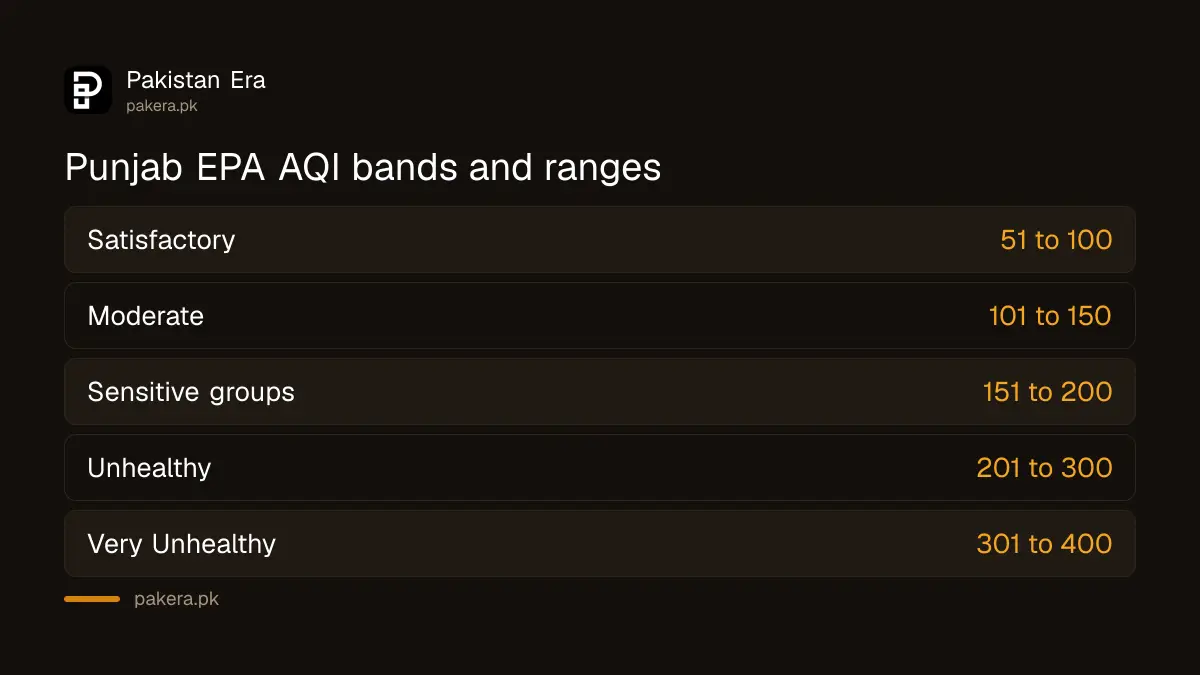
Punjab EPA uses seven bands, from Good (0 to 50) to Hazardous (401 to 500). Its advice gets stricter at each step. The table sums up what the health advisory page says for everyone and for vulnerable groups.
| Band | AQI range | Punjab EPA advice for everyone | Advice for vulnerable groups |
|---|---|---|---|
| Good | 0 to 50 | Ideal for all outdoor activity | Make use of the clean air |
| Satisfactory | 51 to 100 | No special care needed | Go ahead with outdoor plans |
| Moderate | 101 to 150 | Check the AQI to plan outdoor activity | Limit outdoor activity, keep a nebuliser ready, see a doctor if breathing problems start |
| Unhealthy for sensitive groups | 151 to 200 | Cut long or heavy outdoor effort | Wear a mask, keep children and elderly indoors, close doors and windows |
| Unhealthy | 201 to 300 | Wear a mask outdoors | Stay indoors as much as possible, N95 mask if going out |
| Very Unhealthy | 301 to 400 | Limit outdoor activity, exercise indoors | Stay indoors, N95 mask and protective glasses if going out |
| Hazardous | 401 to 500 | Stay indoors | Stay at home, use an air purifier, check health vitals |
Vulnerable groups are children, older people, pregnant women and anyone with asthma, lung or heart disease. Our guides on which mask works in smog and protecting pregnant women and heart and asthma patients add NIH's advice.
Multan compared with nearby cities
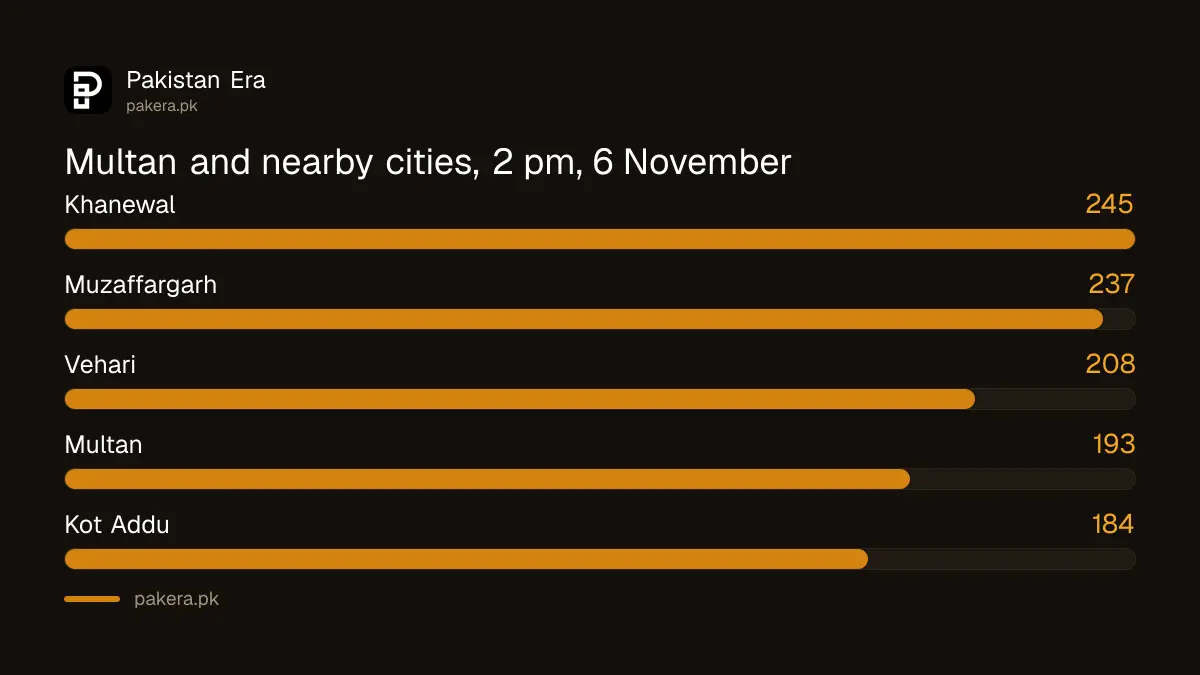
Multan sat in the middle of Punjab's worst belt on 6 November. Khanewal, the next district to the north-east, was the worst city in the province at 245, and Muzaffargarh across the Chenab read 237.
| City | AQI at 2 pm, 6 November | Band |
|---|---|---|
| Khanewal | 245 | Unhealthy |
| Muzaffargarh | 237 | Unhealthy |
| Vehari | 208 | Unhealthy |
| Multan | 193 | Unhealthy for sensitive groups |
| Kot Addu | 184 | Unhealthy for sensitive groups |
Nearby readings help when you travel. If the city you are driving to is a band worse, plan the trip for the middle of the day and keep car windows closed in heavy traffic.
What to do on a bad air day in Multan
Check the reading before you go out, cut heavy outdoor effort once it passes 150, and keep children and older relatives indoors when it passes 200. Report smoke sources you see through Punjab's official complaint app.
- Keep doors and windows shut on high readings, and open them when the AQI drops.
- Wear a well-fitted N95 or KN95 mask outdoors when the band is Unhealthy or worse.
- Report crop burning, smoky kilns or smoking vehicles on the Green Punjab app. Our page on crop burning fines explains the penalties.
- Watch for school orders. Our guide to checking smog school closures shows where they appear.
See a doctor if a child breathes fast, or anyone has a cough that will not settle, chest tightness or wheezing. If someone has chest pain or cannot breathe, go to an emergency department at once; Children's Hospital Multan's numbers and clinics are on our page.
Common questions
Where can I check Multan's AQI today?
On Punjab EPA's official dashboard, aqi.punjab.gov.pk. It is free, updates hourly and ranks Multan with every other Punjab city.
What was Multan's AQI on 6 November 2026?
193 at 2 pm, in the Unhealthy for sensitive groups band. The highest station was MNS University of Engineering and Technology at 196.
How many monitoring stations does Multan have?
Two on the Punjab EPA dashboard: MNS University of Engineering and Technology and BZU Multan.
Is the Punjab EPA scale the same as other AQI apps?
Not exactly. Punjab EPA uses its own seven bands, with 101 to 150 called Moderate. Other apps may use different names or sensors, so the official dashboard is the figure to rely on in Punjab.
Why is Multan's air often worse than Lahore's in the afternoon?
On 6 November the worst readings were across south Punjab, from Khanewal to Rahim Yar Khan. Punjab EPA's dashboard showed PM2.5 as the main pollutant in that whole belt. It does not say what caused it on the day, so we do not guess.
How often does the reading change?
Every hour. Check the "Last updated" time on the dashboard, because night and early morning readings are often far higher than the afternoon.
How we verified this
What we checked, where we read it, and what we could not confirm.
Last checked on 6 November 2026 at about 3 pm PKT, when the Punjab EPA AQI dashboard showed its 2 pm reading. Station values, city ranks and the map are from that dashboard. The bands and advice are from its health advisory page. The station averages are our own arithmetic. Readings change every hour, so treat the figures here as a worked example and check the live dashboard.
About the author

Public Services and Education Journalist
Fajr Riaz is a journalist and content writer at Pakistan Era, based in Lahore. She covers the questions people meet in everyday life in Pakistan: how a public service works, what a change in the rules means, and where to find a reliable answer.